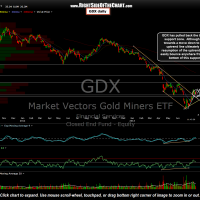
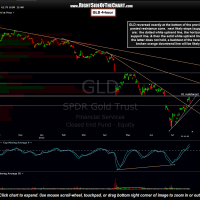
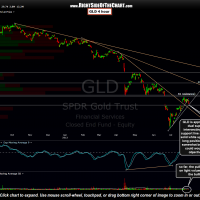
A week ago today, one day after booking profits on many of my mining stocks, I posted the following GLD & GDX charts, along with my thoughts in a follow-up post. Basically, my thoughts remain the same: I think that GDX might ultimately move lower to tag the yellow uptrend line as shown on these daily charts. However, my confidence is not very high on that scenario and with GDX now approaching the top of a relatively thin resistance zone, this looks like an objective area to add back some long exposure to the sector. Depending on one’s current positioning, trading style & outlook on the sector, one might continue to scale in by adding additional lots on select mining stock positions here (or GDX, if being used as a proxy). leaving some dry powder to continue scaling into those positions whether we move higher or lower from here; while another option might be to take a larger position with stops not far below the bottom of the GDX support zone (especially if GLD breaks support as well.) Posted below are the previous and updated chart of GLD (4-hour time frame) and GDX (daily time frame).
Results for {phrase} ({results_count} of {results_count_total})
Displaying {results_count} results of {results_count_total}


