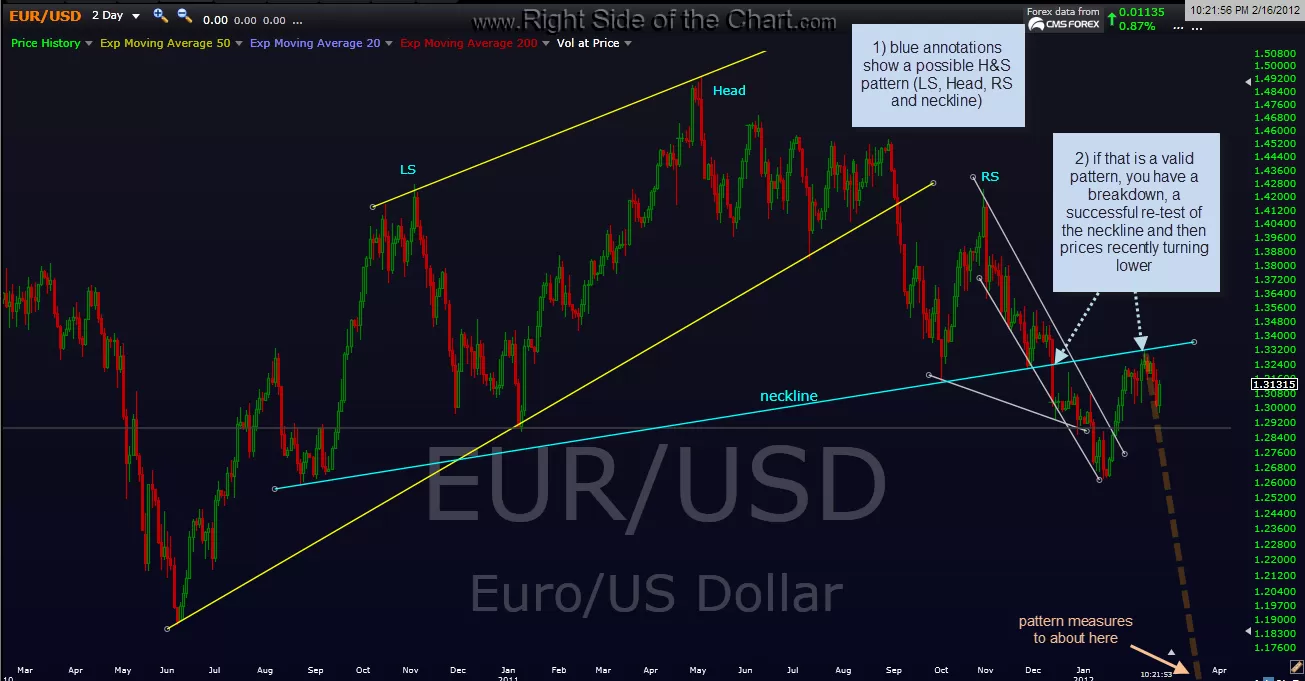
here’s something else that i’ve noticed on the EUR/USD. on my EUR/USD daily chart, i’ve had the wedge pattern (yellow trendline) for months, well before the pattern broke down. then a couple of months ago, another blogger had brought to my attention this possible head & shoulders pattern (blue annotations). although i doesn’t fit the usual profile of a H&S as a topping pattern, as the pattern did not form after a substantial uptrend it still could, nonetheless, play out as so many other technical patterns that have lacked the proper criteria have in this thinly traded market that is clearly only being played via retail and institutional traders right lately (the retail public has long exited this market).
anyway, even if this H&S is not valid, if you look at how perfectly prices turned back down off that yellow “neckline” on the “re-test” after the pattern broke down, at the very least that is now a valid trendline, as that was at least the 4th reaction (or cluster of reactions) off that line. just something to watch since if, by chance, that is a H&S that wants to play out to it’s measured target, then the EURO will be going a lot lower from here.
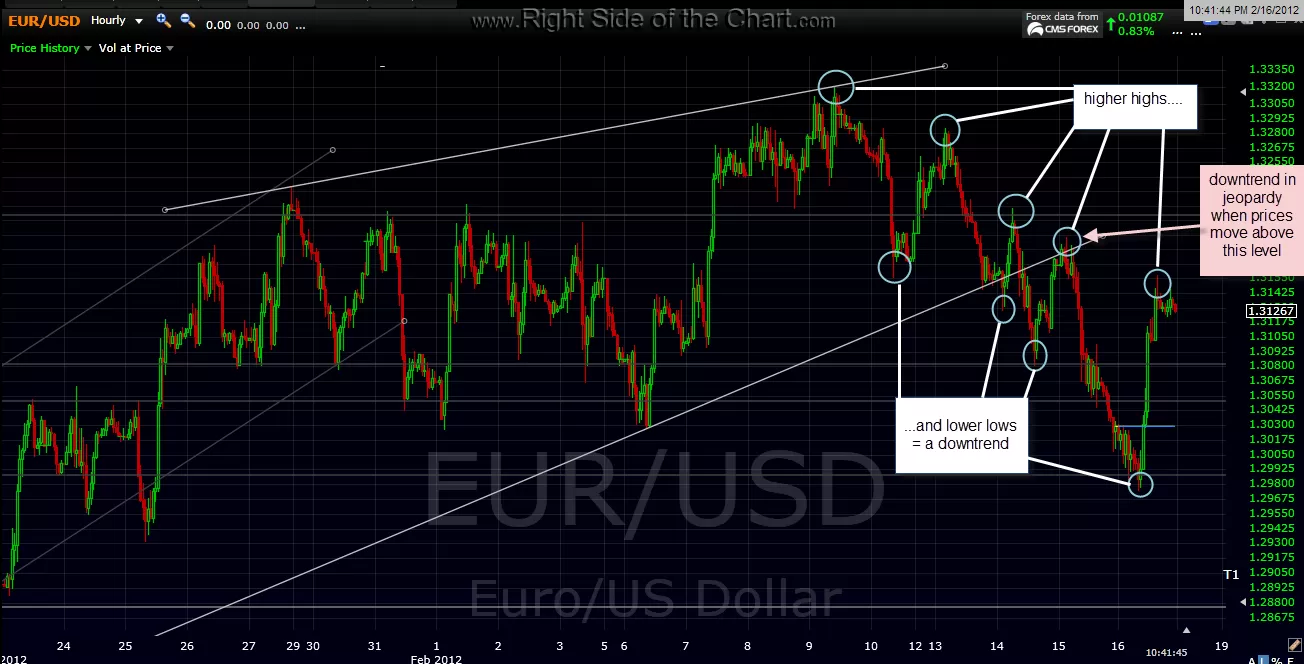
fortunately for the EURO bulls, the odds of that scenario playing out will be greatly diminished if/when the current near-term downtrend on the EUR/USD is reversed. as the 60 min chart below shows, regardless of the bounce today, the EUR/USD still remains in an immediate downtrend (series of lower highs and lower lows) and only a move above the previous reaction high would reverse or put that trend in jeopardy.