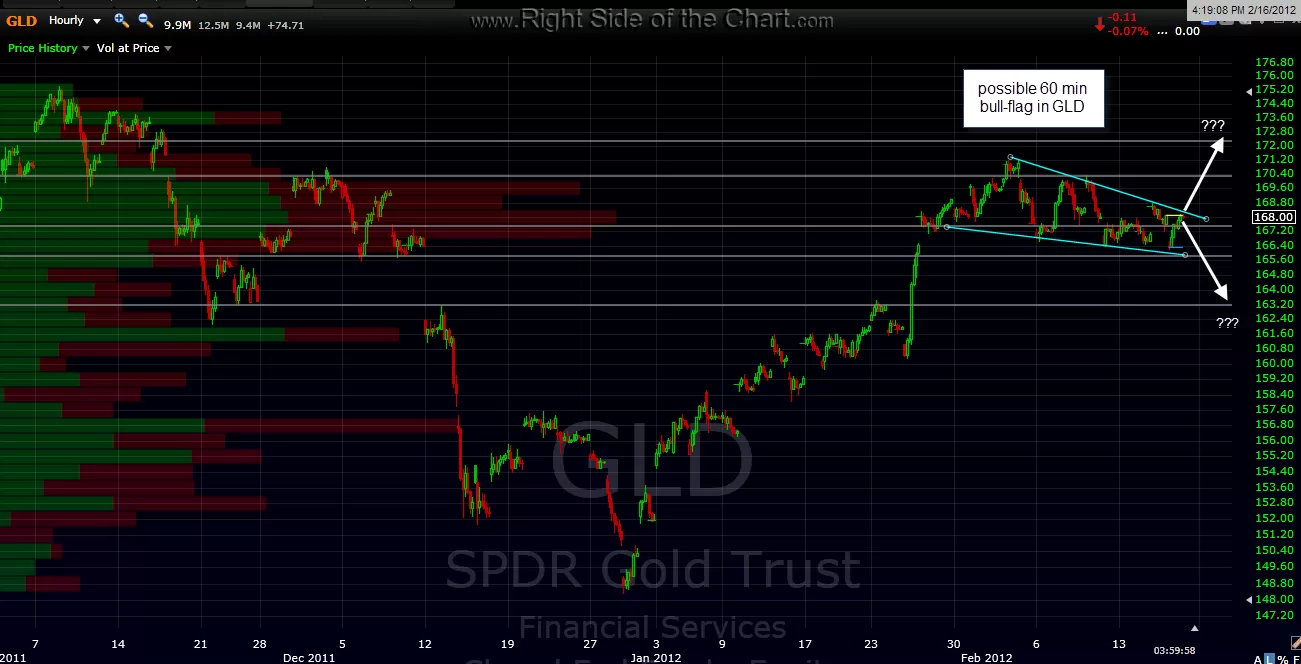
from left to right: 60 min chart of GLD does look to show a possible bull-flag, which obviously would not bode well for the GLD swing short trade if it breaks to the upside. based on how mature the pattern seems to be, it will probably resolve one way or the other in the next day or two. this is not a recommendation for anyone else but personally, i often pull my standing stop orders on swing positions that are close to being triggered on or just before options expiration day, to avoid getting clipped out on all the OPEX trading noise. that can cut both ways of course, so DYODD and set your own stops according to your own risk tolerance and trading style/plan.
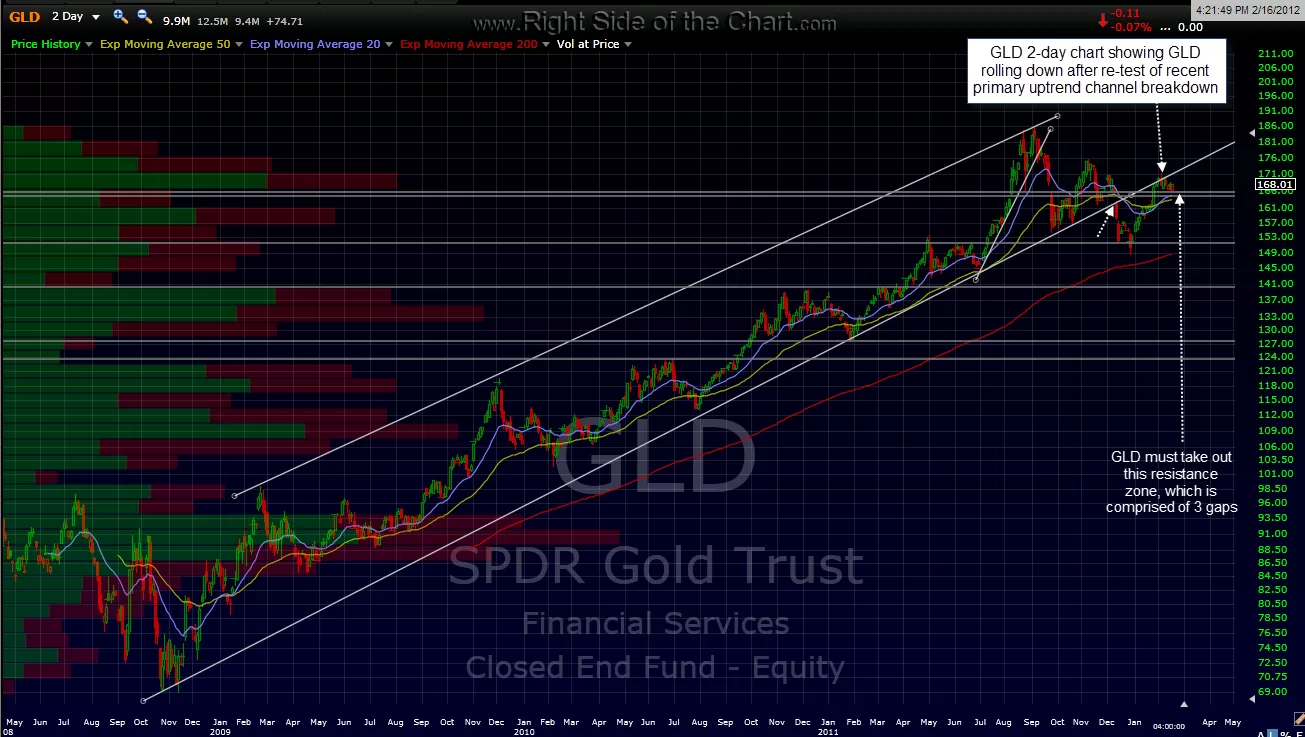
next chart is the 2-day GLD showing the original channel breakdown and the recent re-test of that channel from below (where the short trade was entered). you can see the two close horizontal lines which mark a pretty solid support level,comprised of 3 gaps and several candlestick touches. so far, GLD has found support there so for this trade to continue to pan out we need prices to break below that level and of course, have that 60 min bull-flag/pennant nullified or fail shortly after an upside break, which i’ll refer to as a “bug” trap if it happens (i’m sure some here will get that).
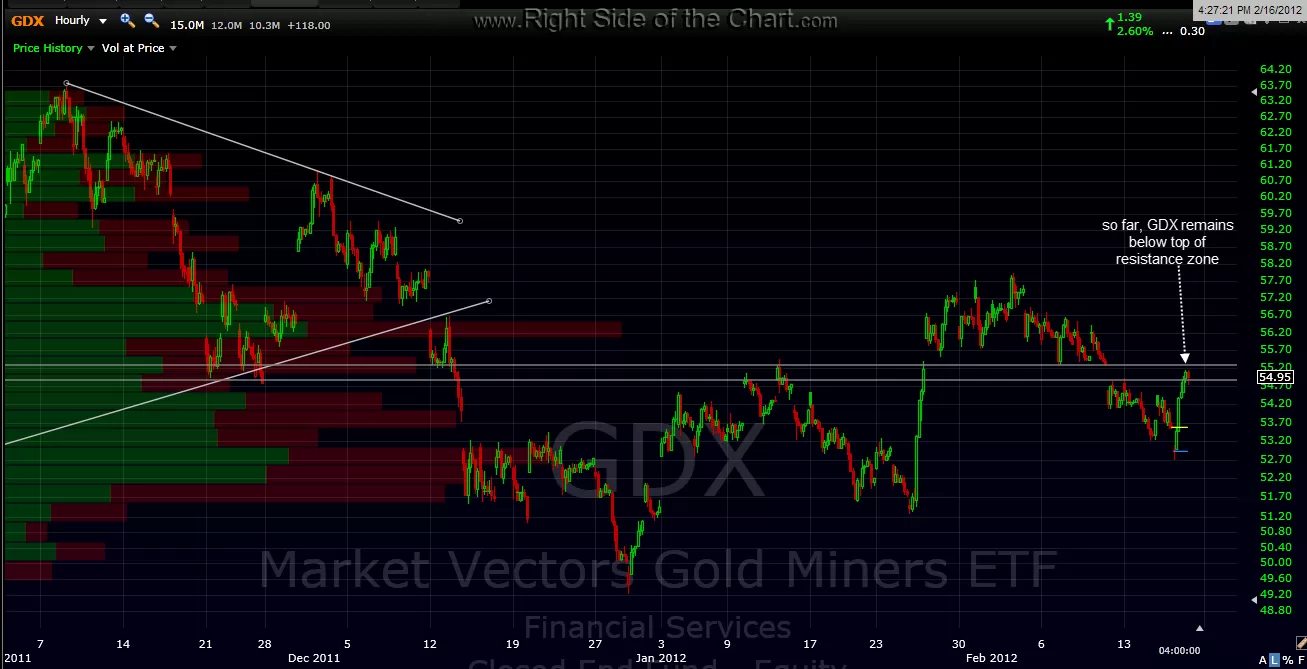
finally, here’s the updated 60 min GDX. as you can see, prices entered that resistance zone (& gap) but stalled about 1/2 way through. not surprising though, considering how far they had to move up to get there today. again, like GLD, we should know by monday or tuesday (ignoring any OPEX noise tomorrow), which way gold and gold stocks want to go next. btw- i did note the big bullish engulfing candlestick on GDX in case anyone was wondering. however, a quick back-scan of the GDX daily will show you that this extremely volatile little sector etf is chock full o’ bullish and bearish engulfing candlesticks that really don’t have much predictive value.