
@b-right asked for an update on the software stocks & I figured that I’d post it on a new homepage post for others that might be interested. I’ve highlighted two objective long entries on IGV (Software Index ETF), the first on March 2nd, calling for a bounce as long as QQQ remained above its 200-day moving averages (which it did until March 20th), although the rally in IGV fell a little shy of my downtrend line backtest target (but still a 16% rally off that 76.16 support & divergent low).
After the Q’s clearly lost their 200-day MA’s & then the bottom of the multi-month trading range to fall & hit T2 on the daily chart, that broad-based selloff took IGV & the software (tech) stocks down for a new 52-week low. On April 10th, the very day IGV bottomed, I once again highlighted it as one of my favorite longs, stating:
“If so, & the market is able to breakout to new highs & hold (and build on) that breakout, IGV is one of the better looking sectors, IMO, & will likely outperform the broad market & QQQ.”
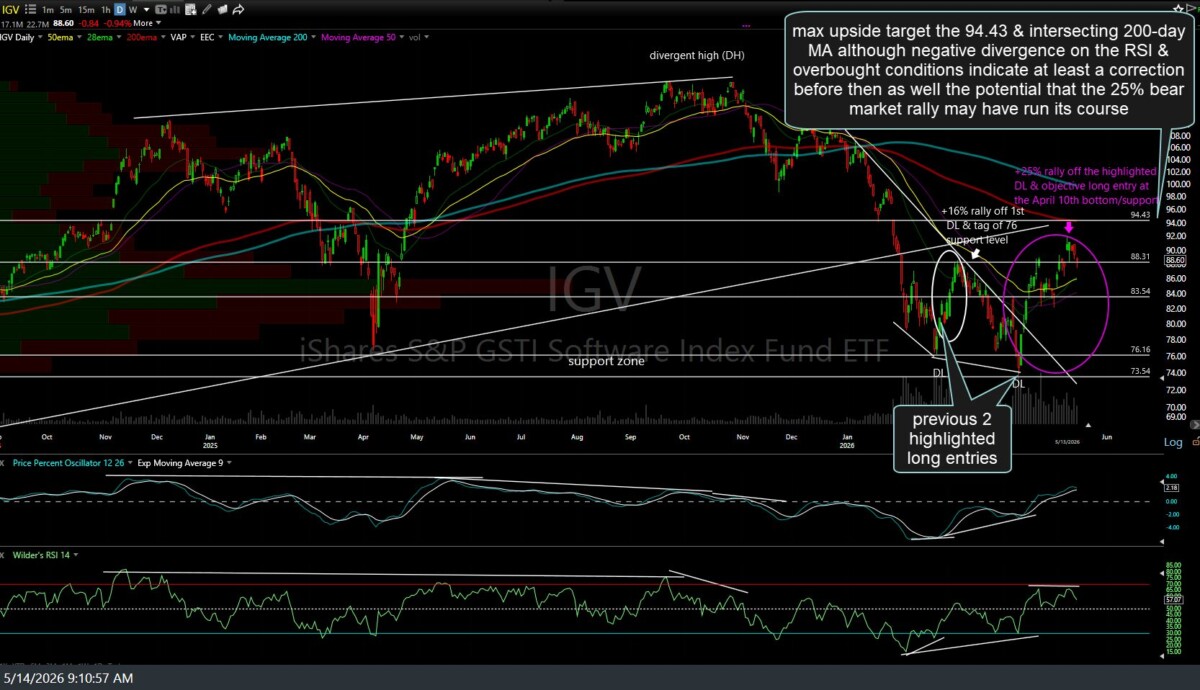
From there, IGV rallied 25% so far vs. a 17% gain in QQQ over the same time period and a 9% gain in the broad market (i.e., the S&P 500), solidly outperforming both. At this time, my maximum upside target is the 94.43 price resistance level & intersecting 200-day MA, although negative divergence on the RSI & overbought conditions indicate the likelihood of at least a correction before then, as well as the potential that the 25% bear market rally may have run its course.
Should IGV pull back before rallying to that max. potential target which comes in around 7% above, other than the current support level it is currently testing (around 88), the next support level & objective long entry (assuming the charts of both IGV & QQQ confirm, at that time) would be the 83.50ish support level. Previous (March 2nd, April 10th & April 14th) followed by the updated daily chart below.
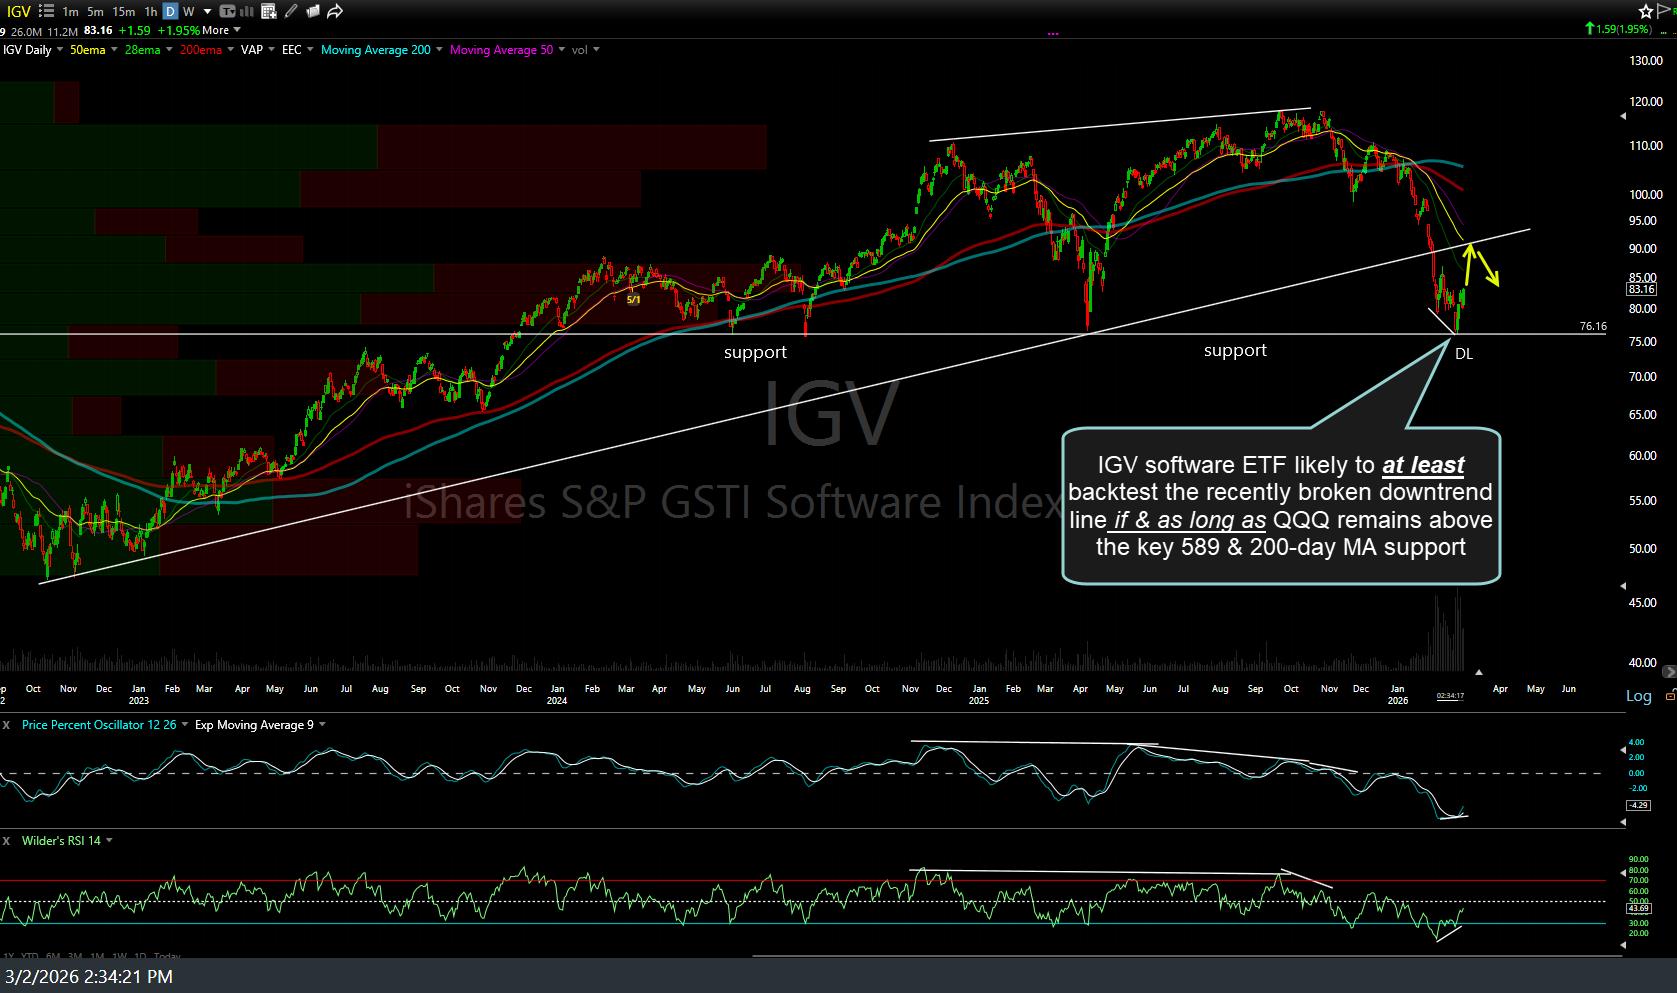
IGV-daily-March-2nd
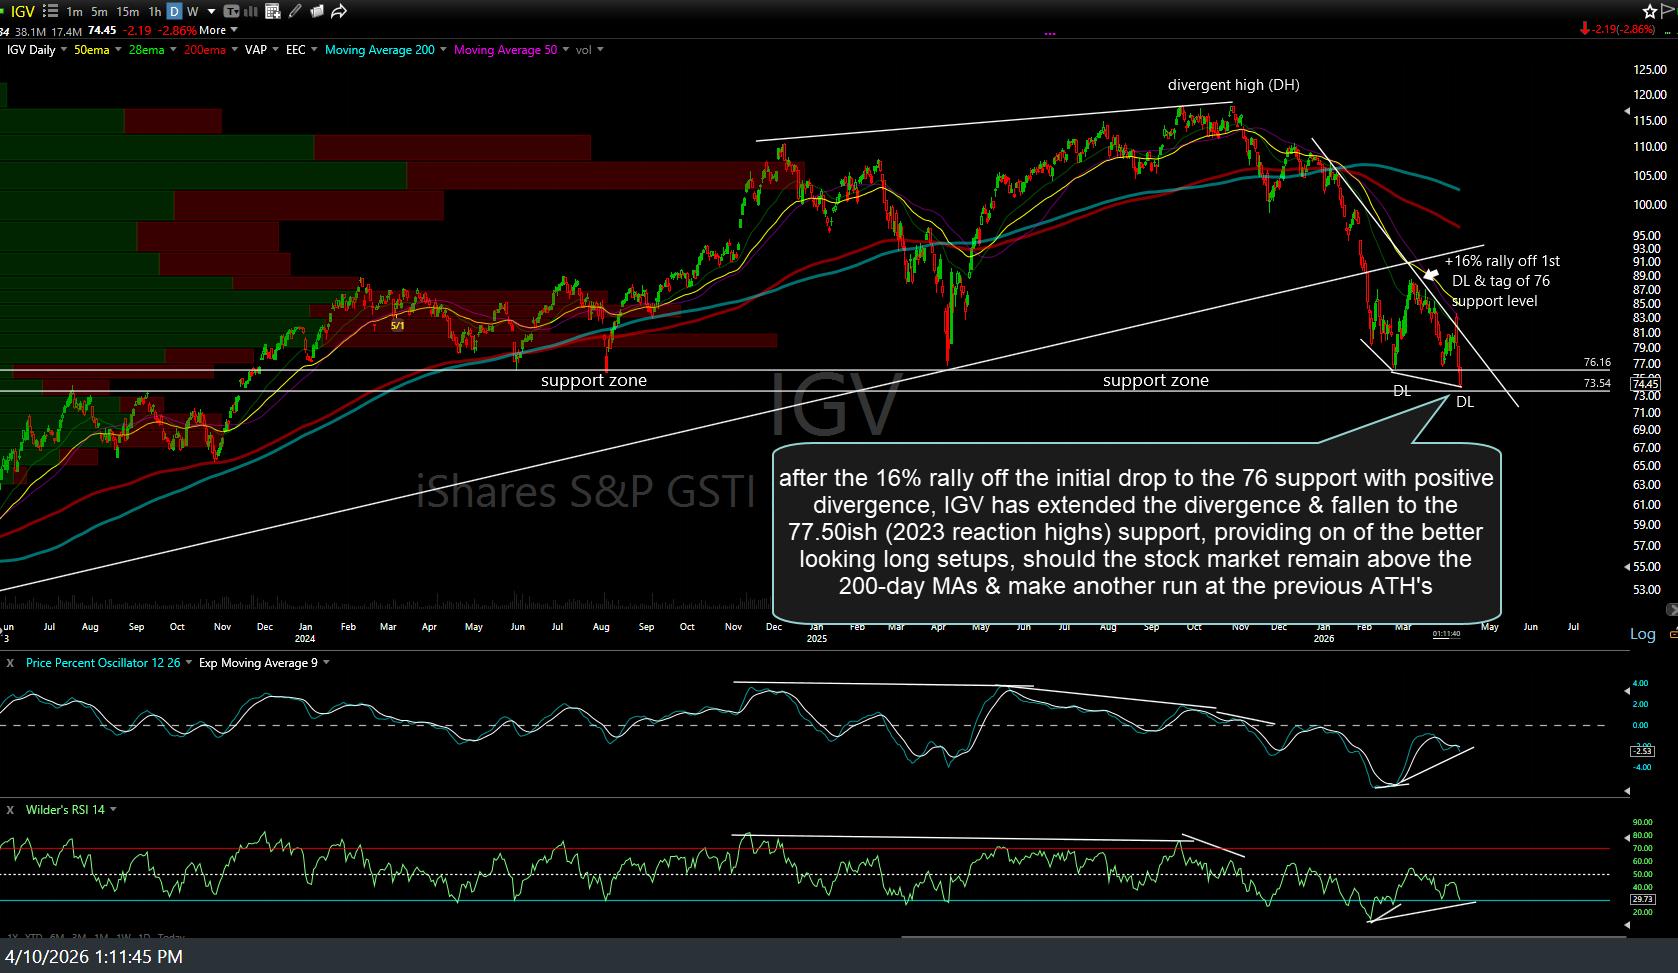
IGV-daily-April-10th
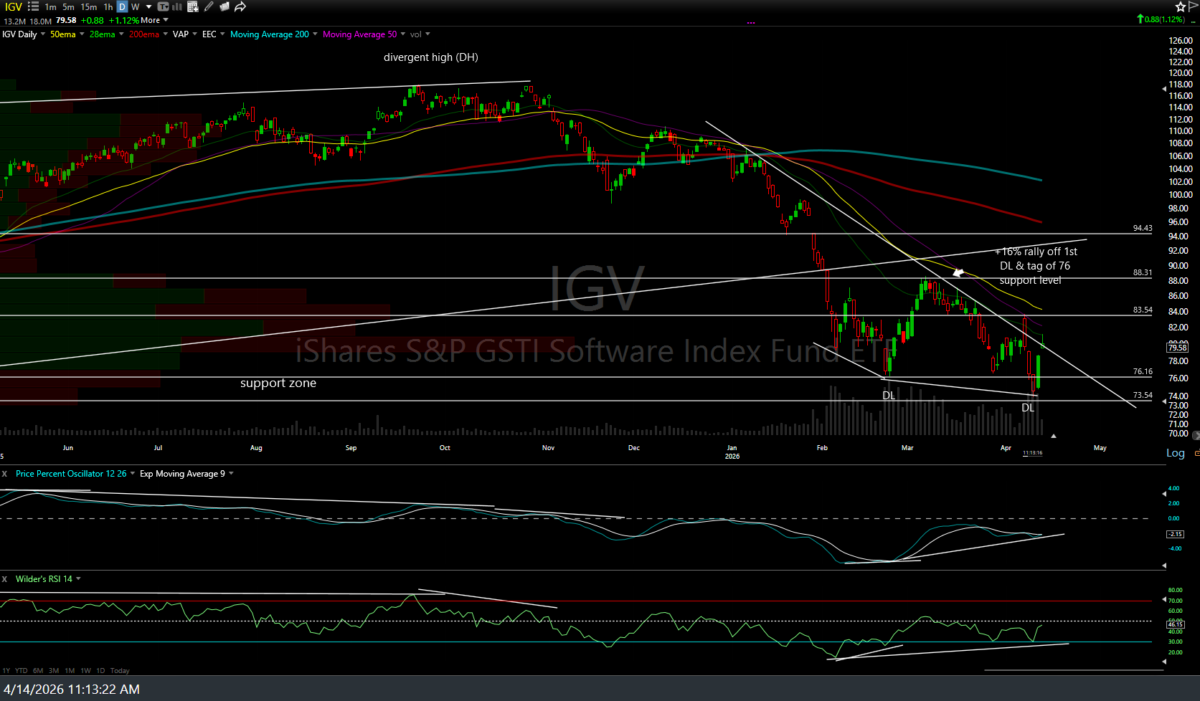
IGV daily April 14th
IGV daily May 14th