
GDX (gold miners ETF) has hit the first price target (T1) on the daily for a 22% profit from the March 5th break below the trendline (sell signal). Screenshot from the March 4th video, at the point I stated ‘the next sell signal would come on a break below this (highlighted) uptrend line”, followed by the updated daily chart below.
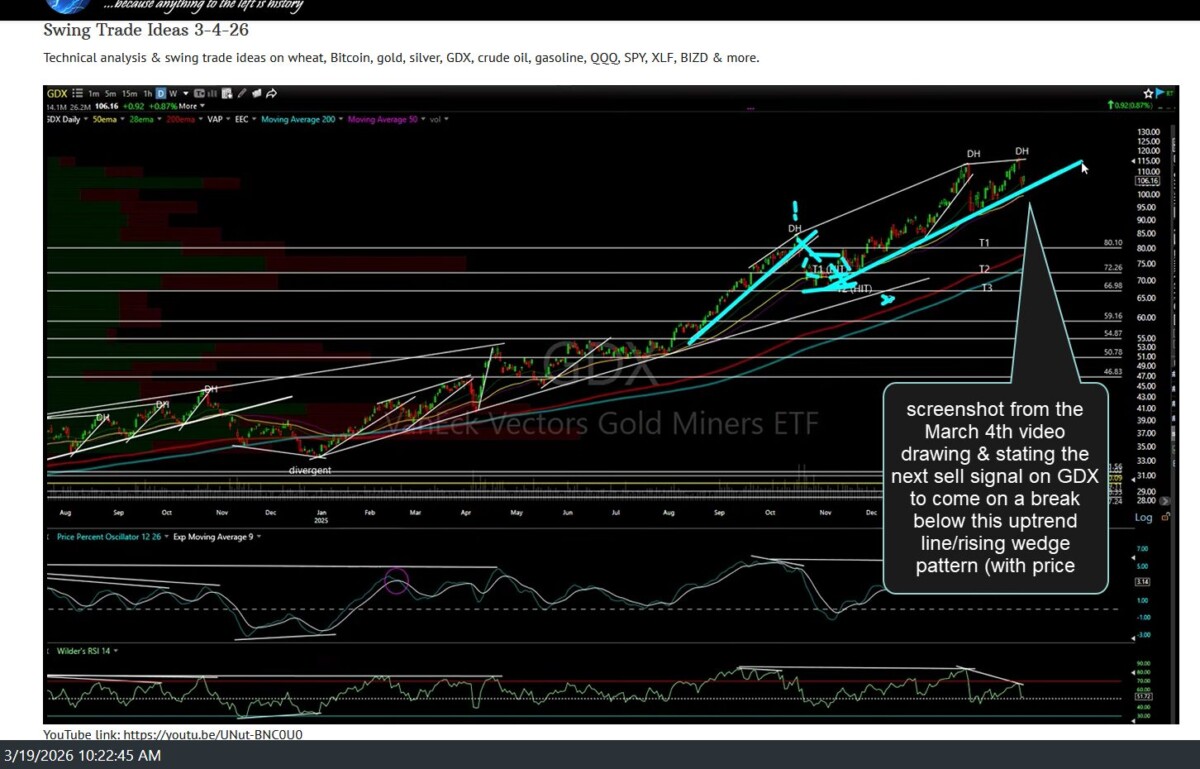
GDX March 4th video screenshot
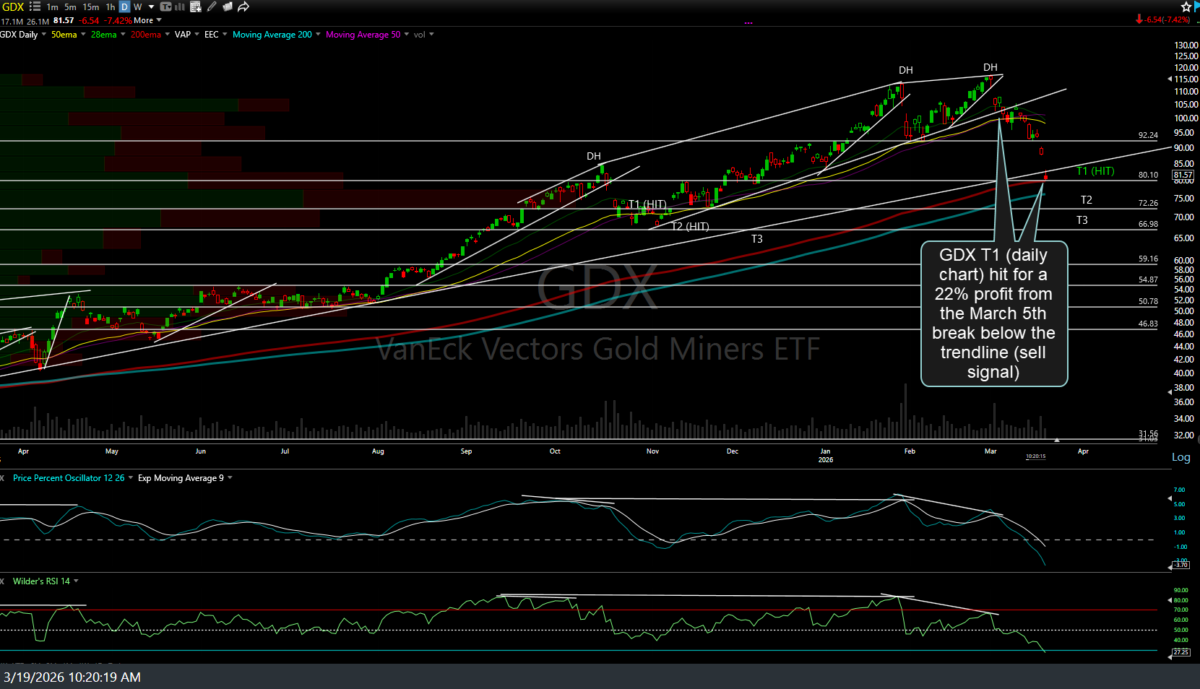
GDX daily March 19th
Previous (Feb 23rd, notating the next pending sell signal at that time) & updated 60-minute chart below, with T4 on the 60-minute time frame being gapped beyond today & (so far) hitting & have a slight reaction off that next support level around 79.87, which correlates with T1 on the longer-term daily time frame.
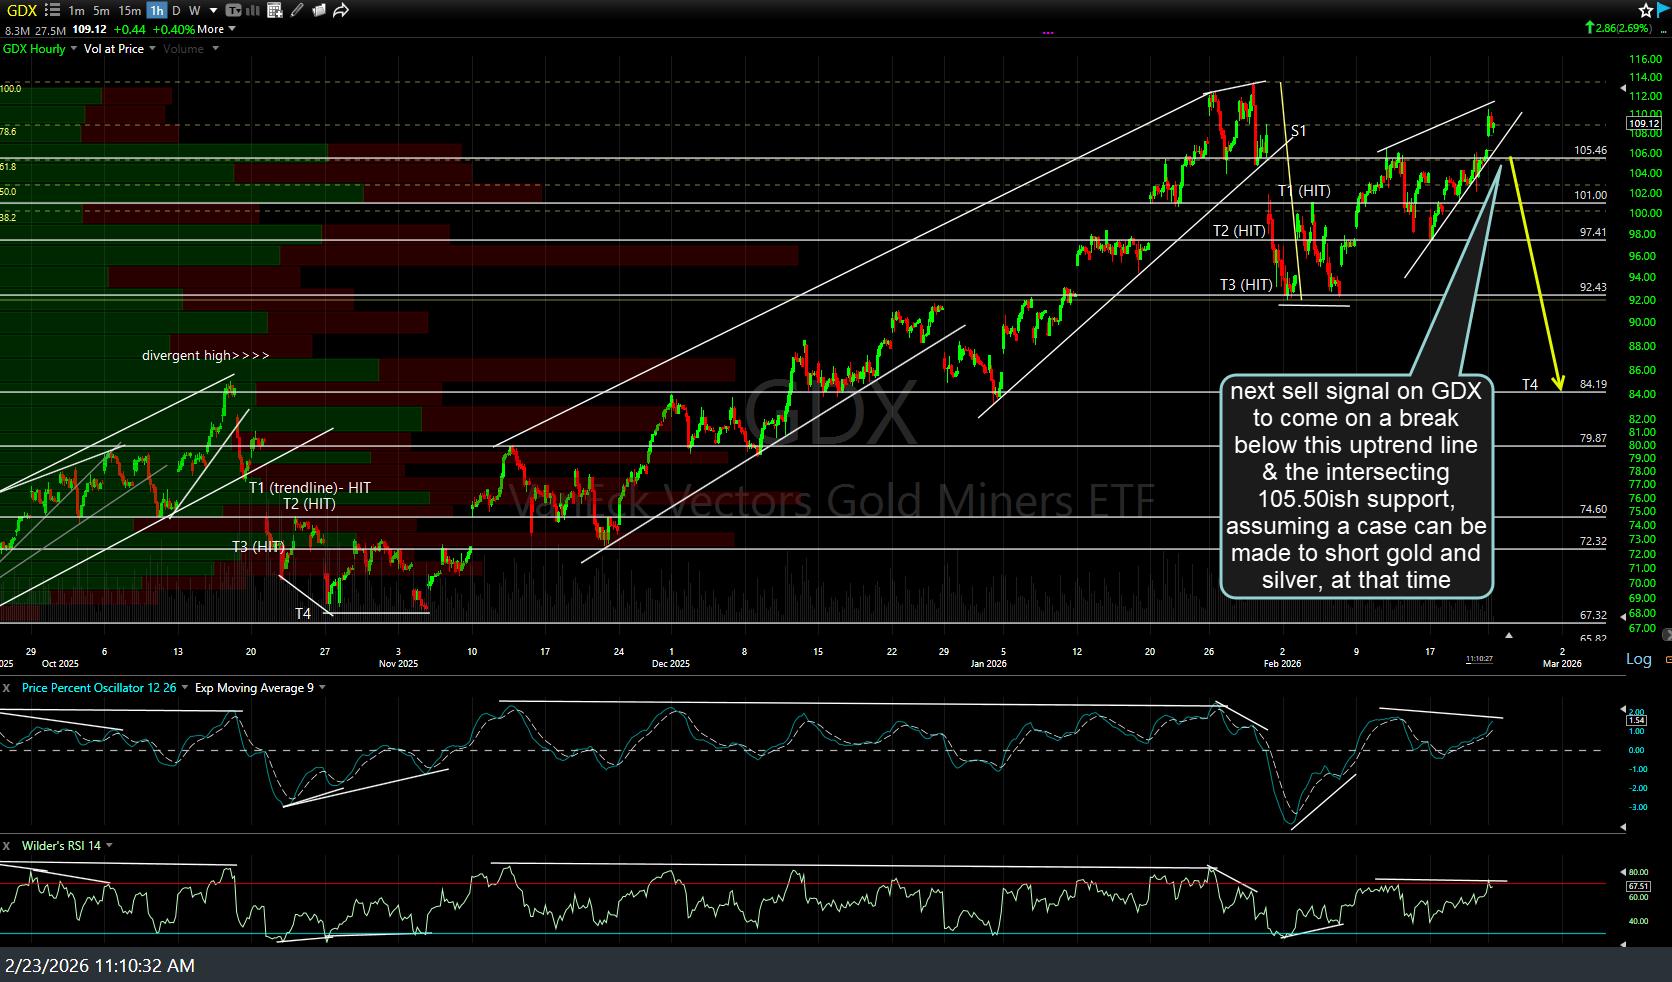
GDX-60m-Feb-23rd
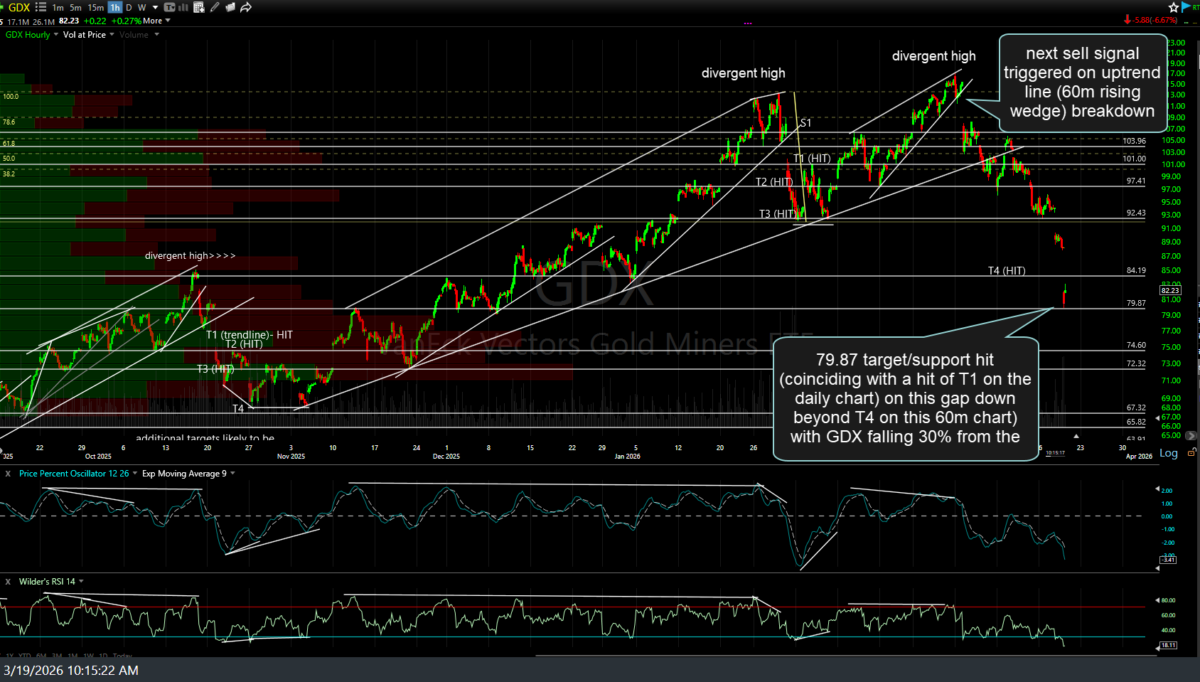
GDX 60m March 19th