
CMCSA (Comcast Corp) offers an objective long entry here at long-term support with positive divergences on nearly all time frames. The weekly chart below shows two potential price targets for longer-term swing & trend traders (at arrow breaks) with a maximum suggested stop on a weekly close below 27.90.
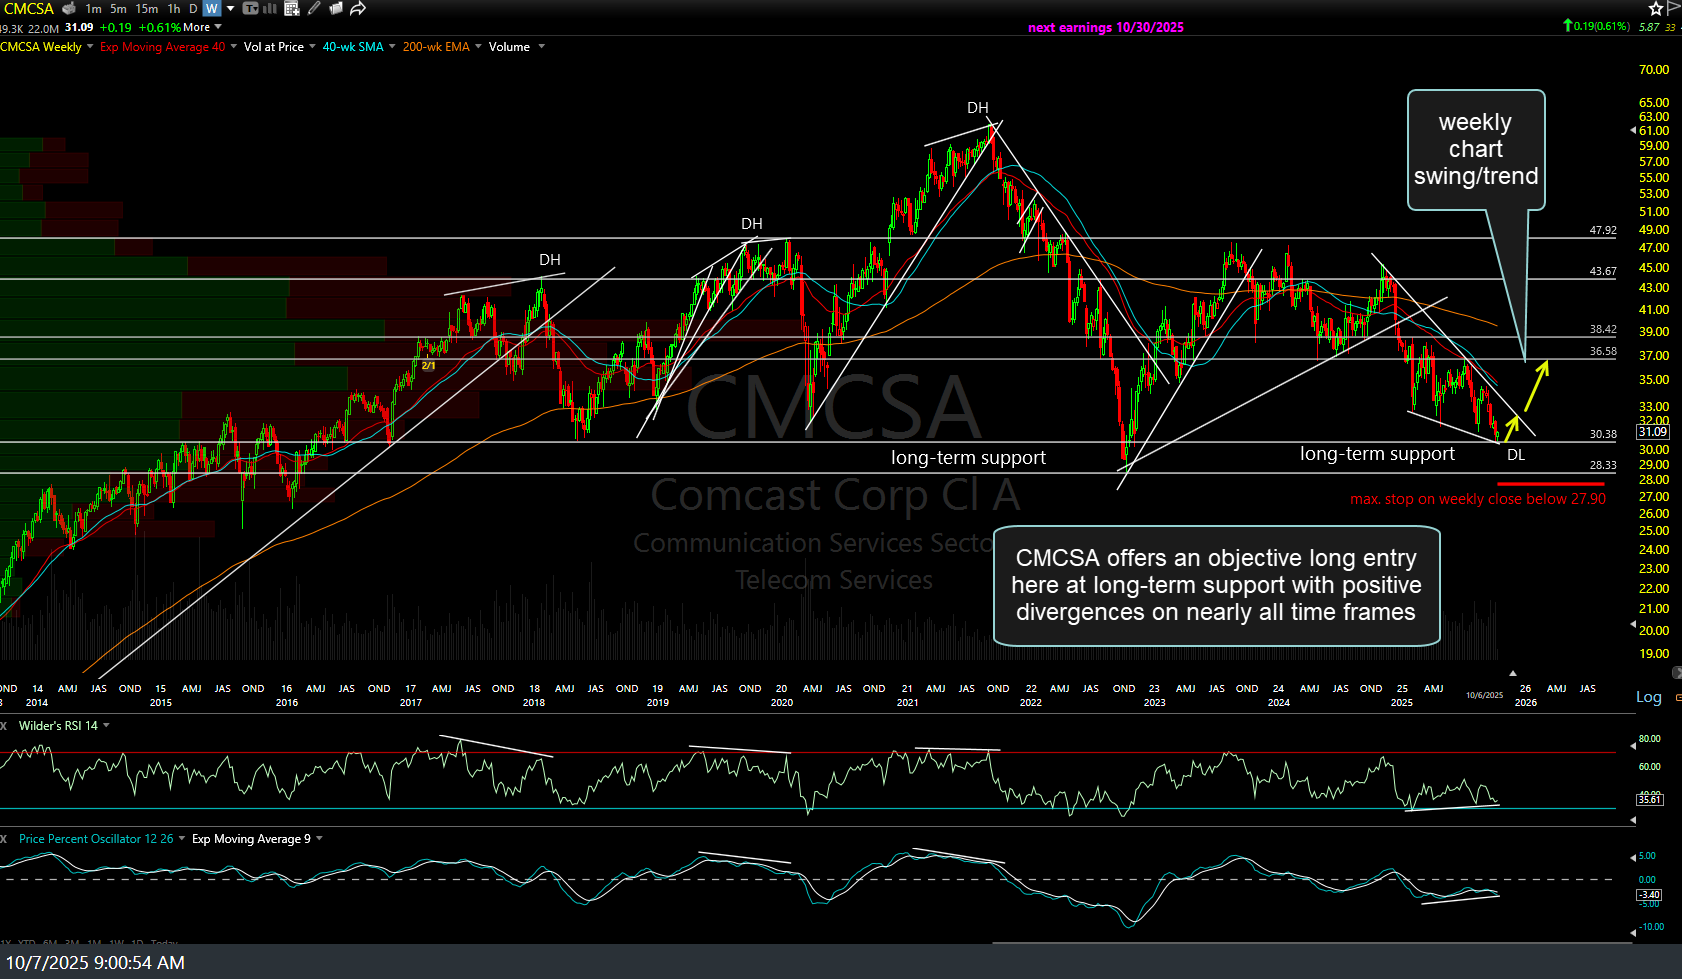
CMCSA weekly Oct 7th
Stepping down to the daily time frame, CMCSA offers an objective long entry here at long-term support and/or on a solid break above this downtrend line with two current price targets (T1 & T2) along with a potential third target around 35.30, depending on how the charts develop going forward.
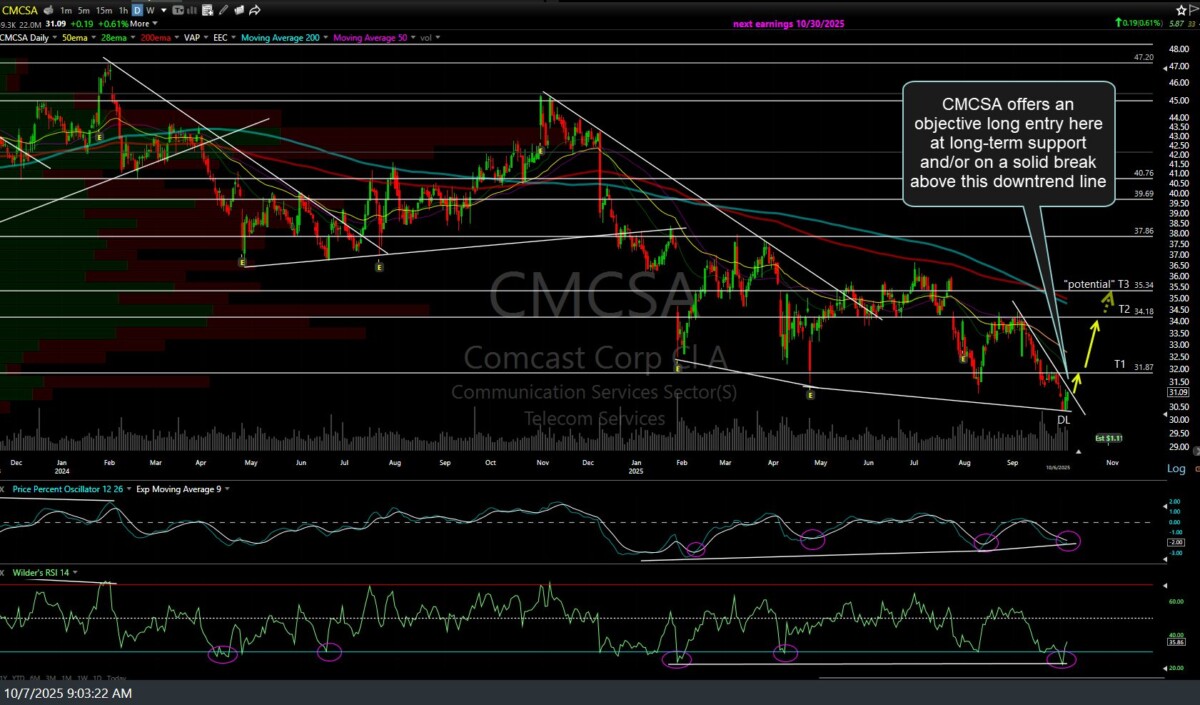
CMCSA daily Oct 7th
Zooming down even further to the 60-minute chart for more active swing traders, CMCSA will trigger a buy signal on a solid break and/or 60-minute close above this bullish falling wedge pattern. Note: CMCSA is scheduled to report in a few weeks. Suggested stops commensurate with one’s average entry price and preferred price target(s). 60-minute chart below.
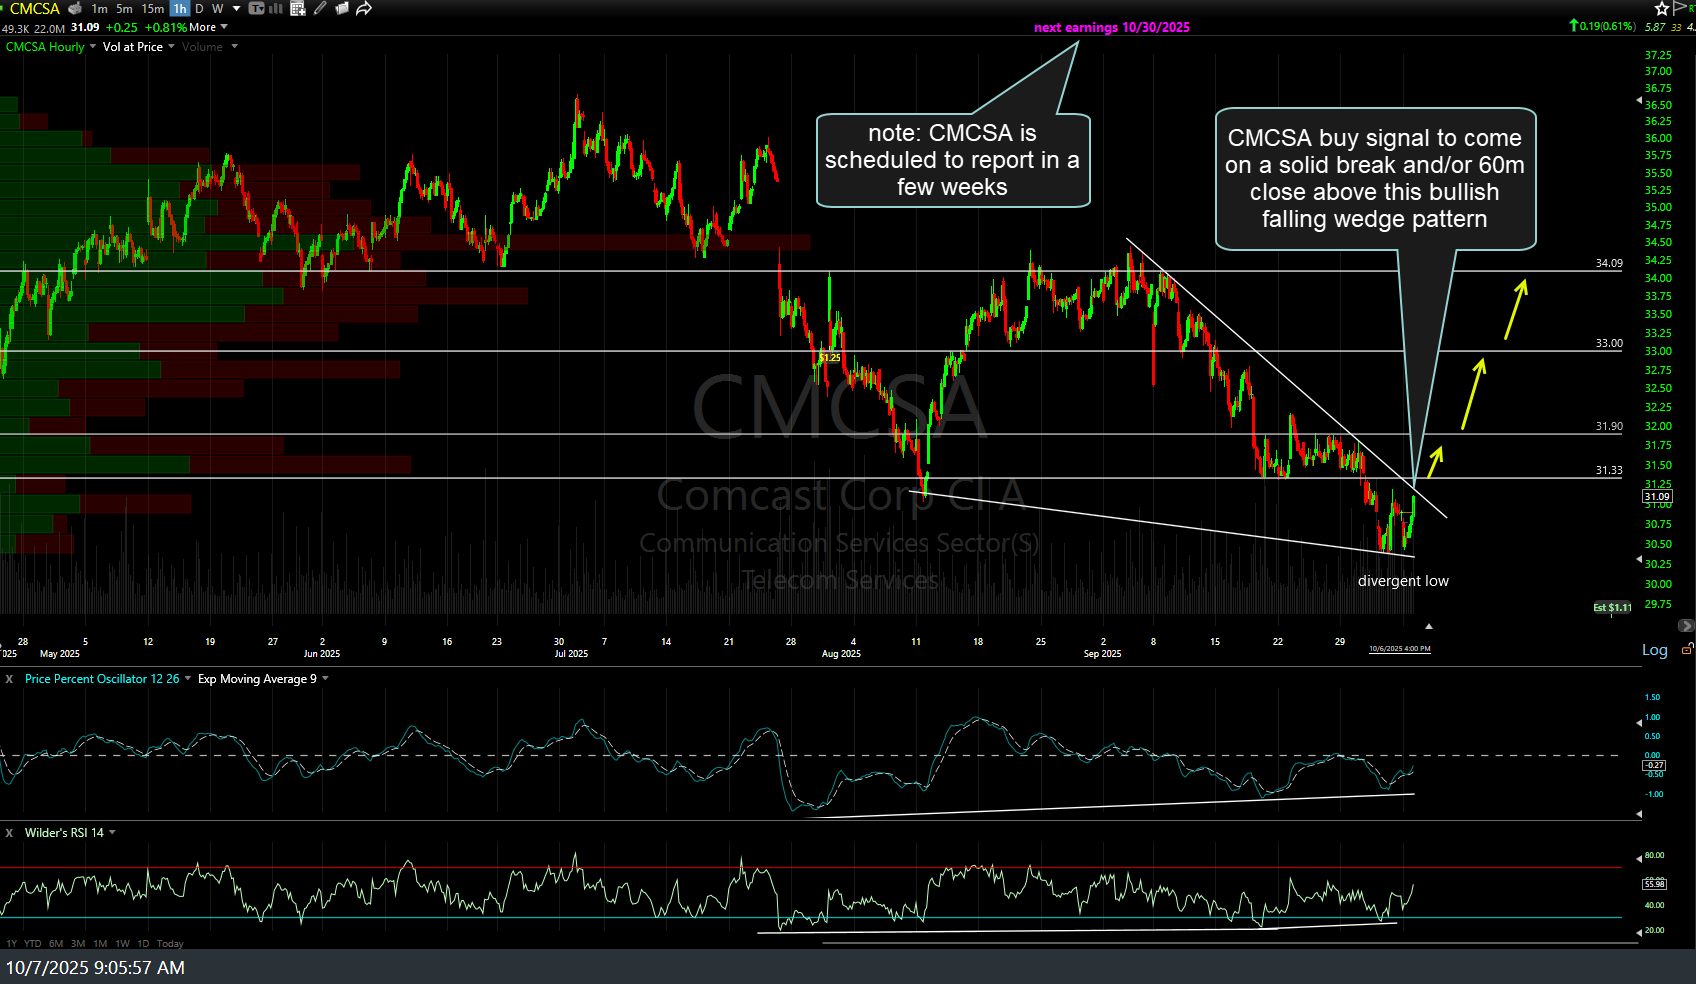
CMCSA 60m Oct 7th