
/RTY (Russell 2000 Small-cap Index futures) is creeping above the downtrend line on an intraday basis with the 2130ish B.O.D. (benefit-of-the-doubt) resistance level just above (bullish if both clearly taken out on a daily closing basis). The recent (May 29th) previous high was a divergent high as would be any marginal new high soon. As such a relatively tight stop about 3% above the 2130 resistance or a slightly wider stop just above the 2225 resistance seems objective to allow for a potential false breakout above the primary downtrend line. Daily chart below.
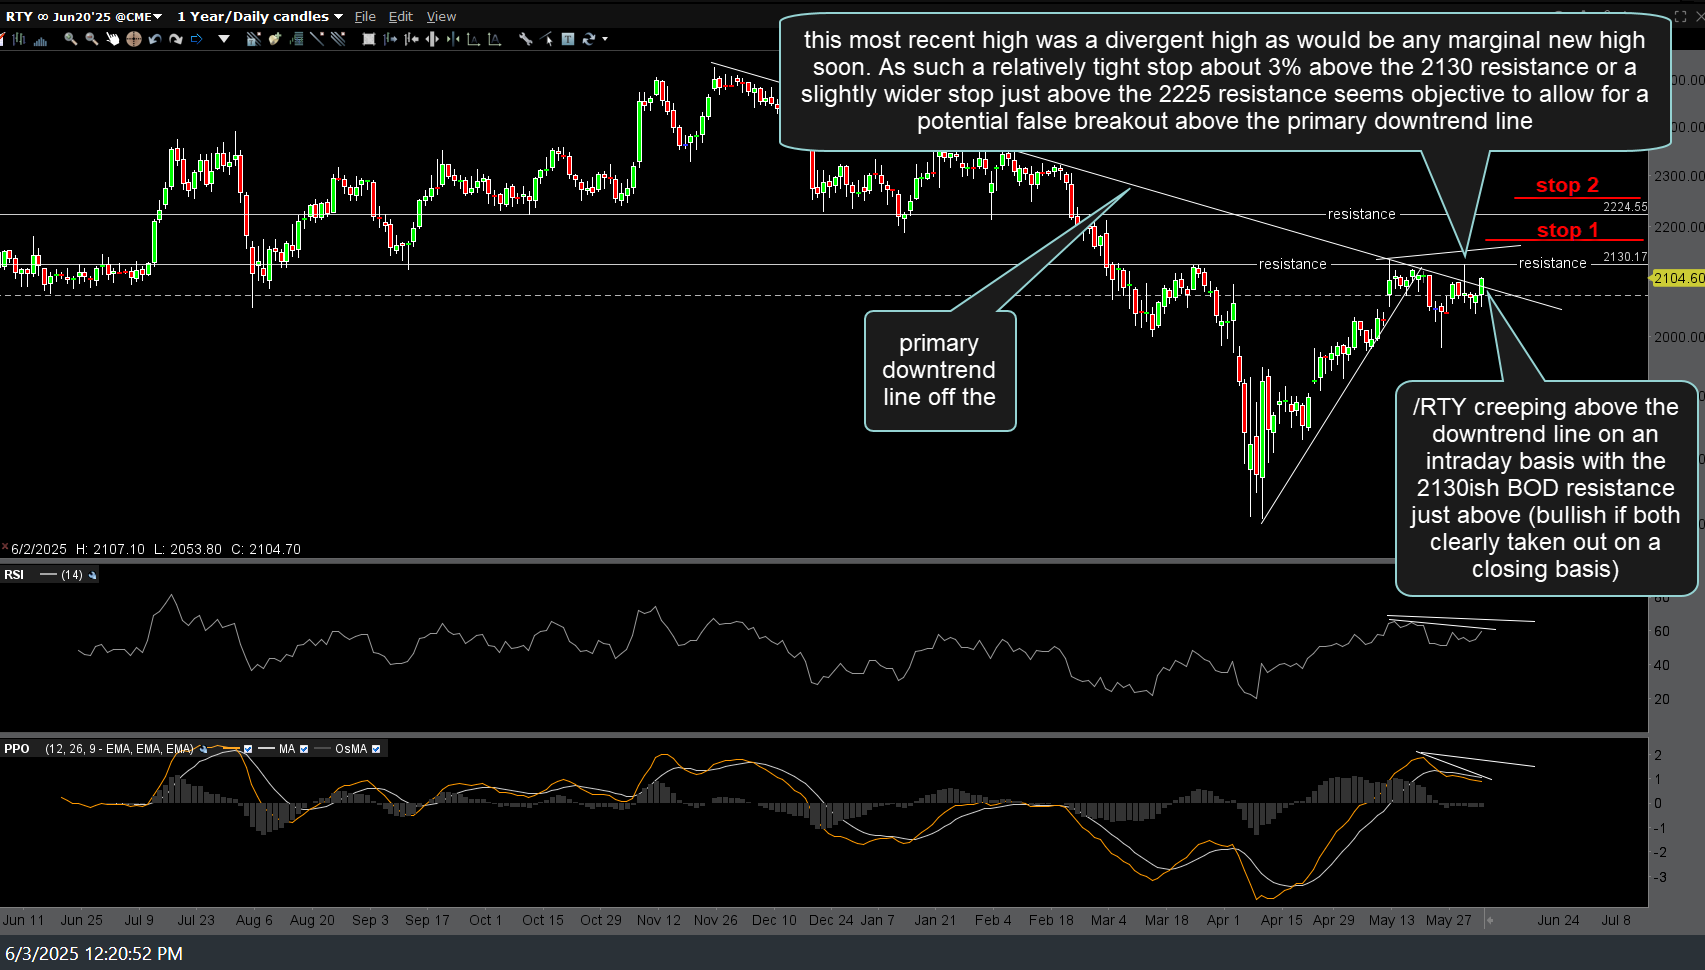
/RTY daily June 3rd
Likewise, IWM (Russell 2000 ETF) is also poking above the primary downtrend line with the 211.13ish BOD resistance level just above. As the dotted yellow lines on the 60-minute chart below illustrate, any marginal new high on a breakout will still be a divergent high but much more than that & the divergences will be taken out, thereby significantly hampering the case to remain short.
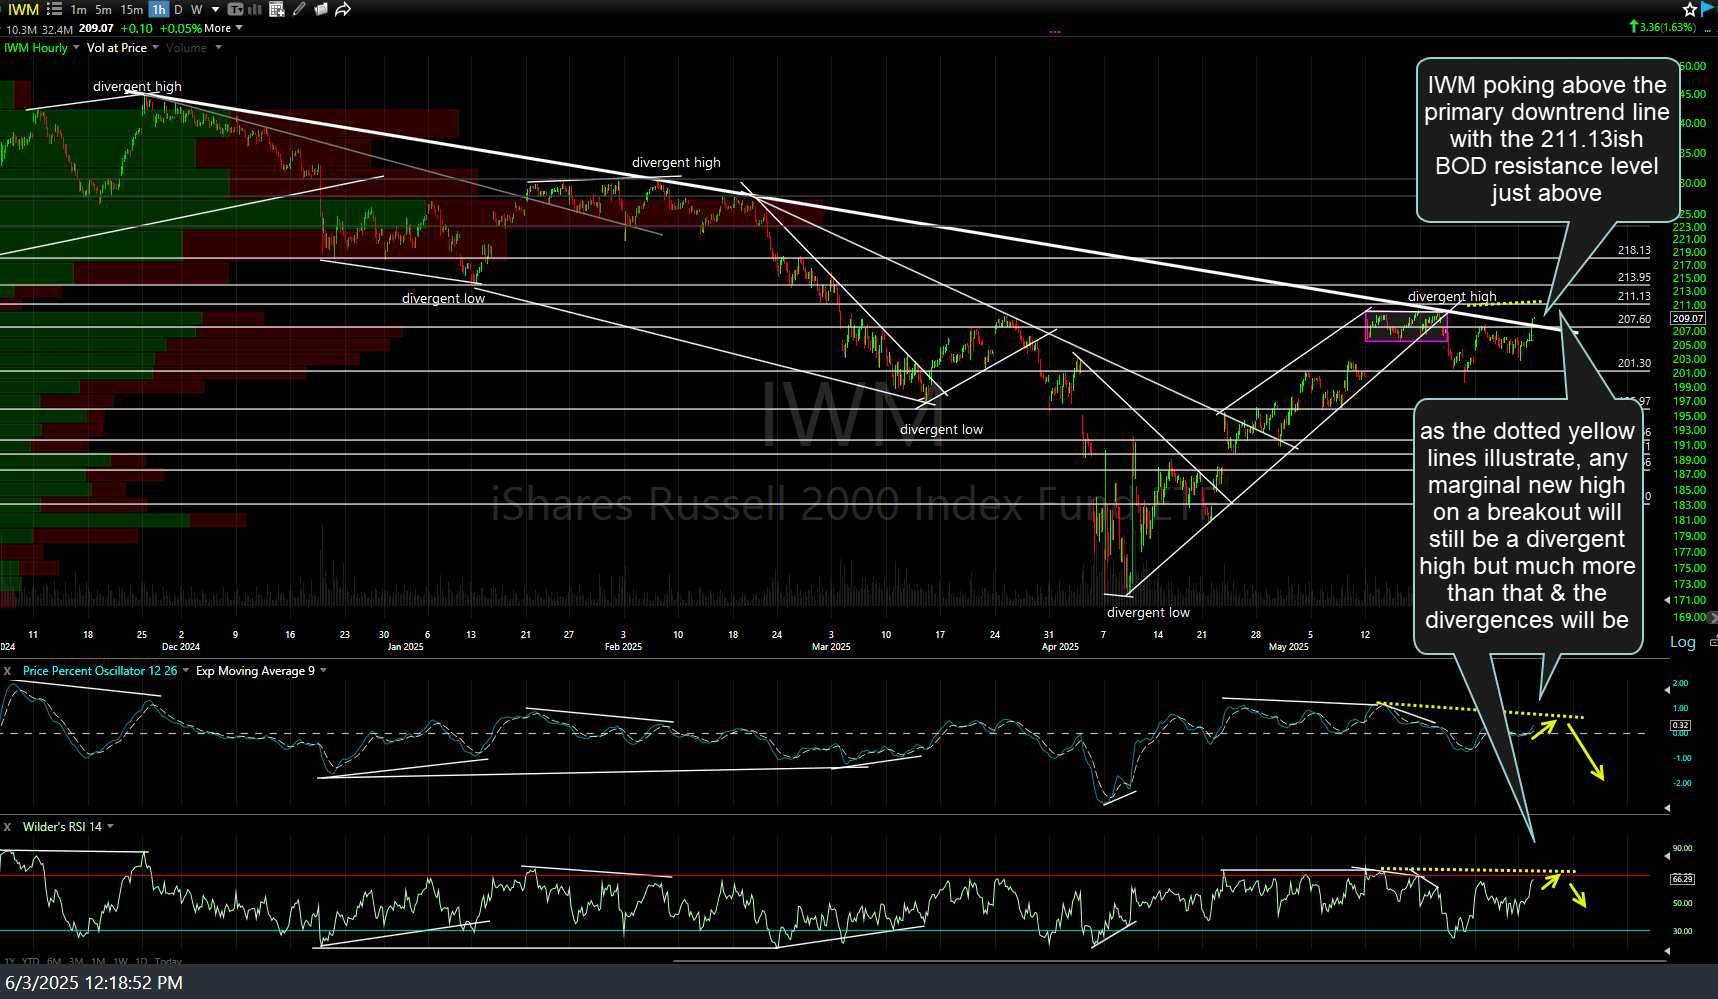
IWM 60m June 3rd
While I’ve highlighted the last couple of rallies into the primary downtrend line as objective levels to short the small-caps over the past week or so, my preference on a breakout, such as this, is to only add-to or initiate a new short position on /RTY or IWM if & only if the breakout clearly fails with a solid move back down below the primary downtrend line (that also assumes that the breakout is first confirmed via a solid daily close above the trendline vs. just another intraday pop above that fails to close above the trendline).
Also, note that the more liberal (~6% stop above the 2130 resistance or ~2-3% above the next resistance around 2225 on /RTY.. .or comparable levels on IWM) would be for a longer-term swing or trend trade targeting the much lower targets on the daily & weekly charts. Typical swing and active traders might opt to use the lower/tight stop somewhat above the /RTY 2130 & IWM 211.13ish resistance levels. Nor do I believe it is objective to add to an existing short position as long as /RTY & IWM are trading above the primary downtrend line.