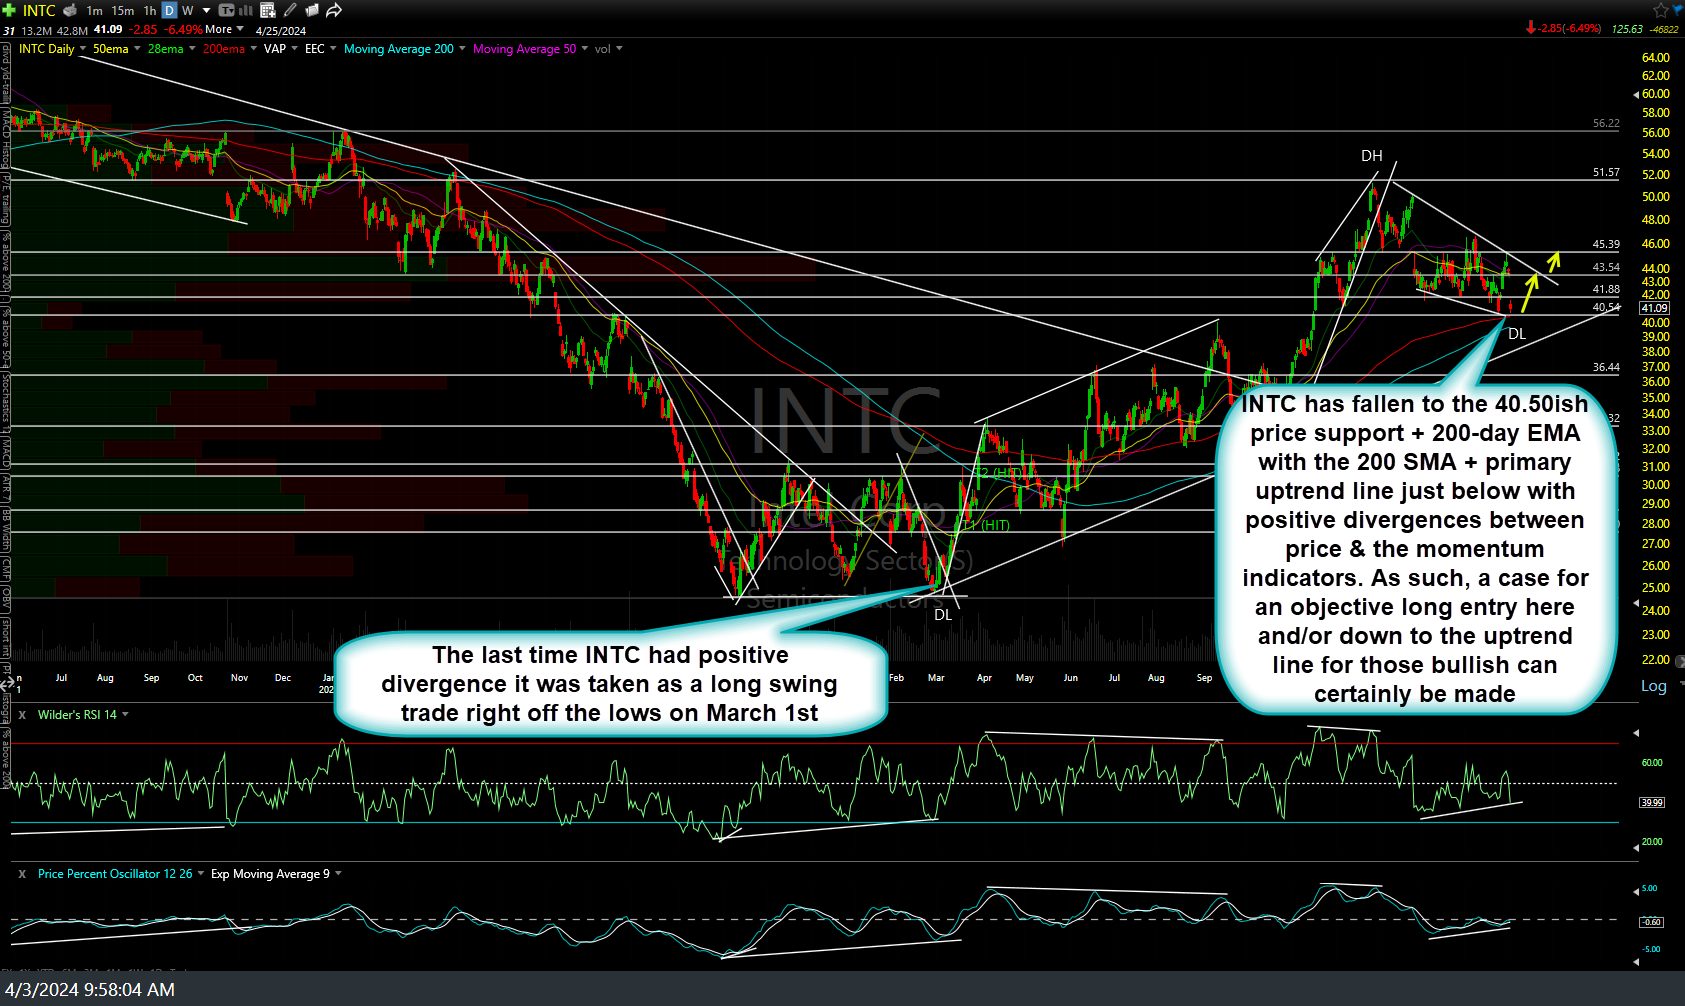
INTC (Intel Inc.) has fallen to the 40.50ish price support + 200-day EMA with the 200 SMA + primary uptrend line just below with positive divergences between price & the momentum indicators. As such, a case for an objective long entry here and/or down to the uptrend line for those bullish can certainly be made. Potential price targets shown at arrow breaks. One could use a relatively tight stop somewhat below the 39 level or on a solid daily close below the primary uptrend line.
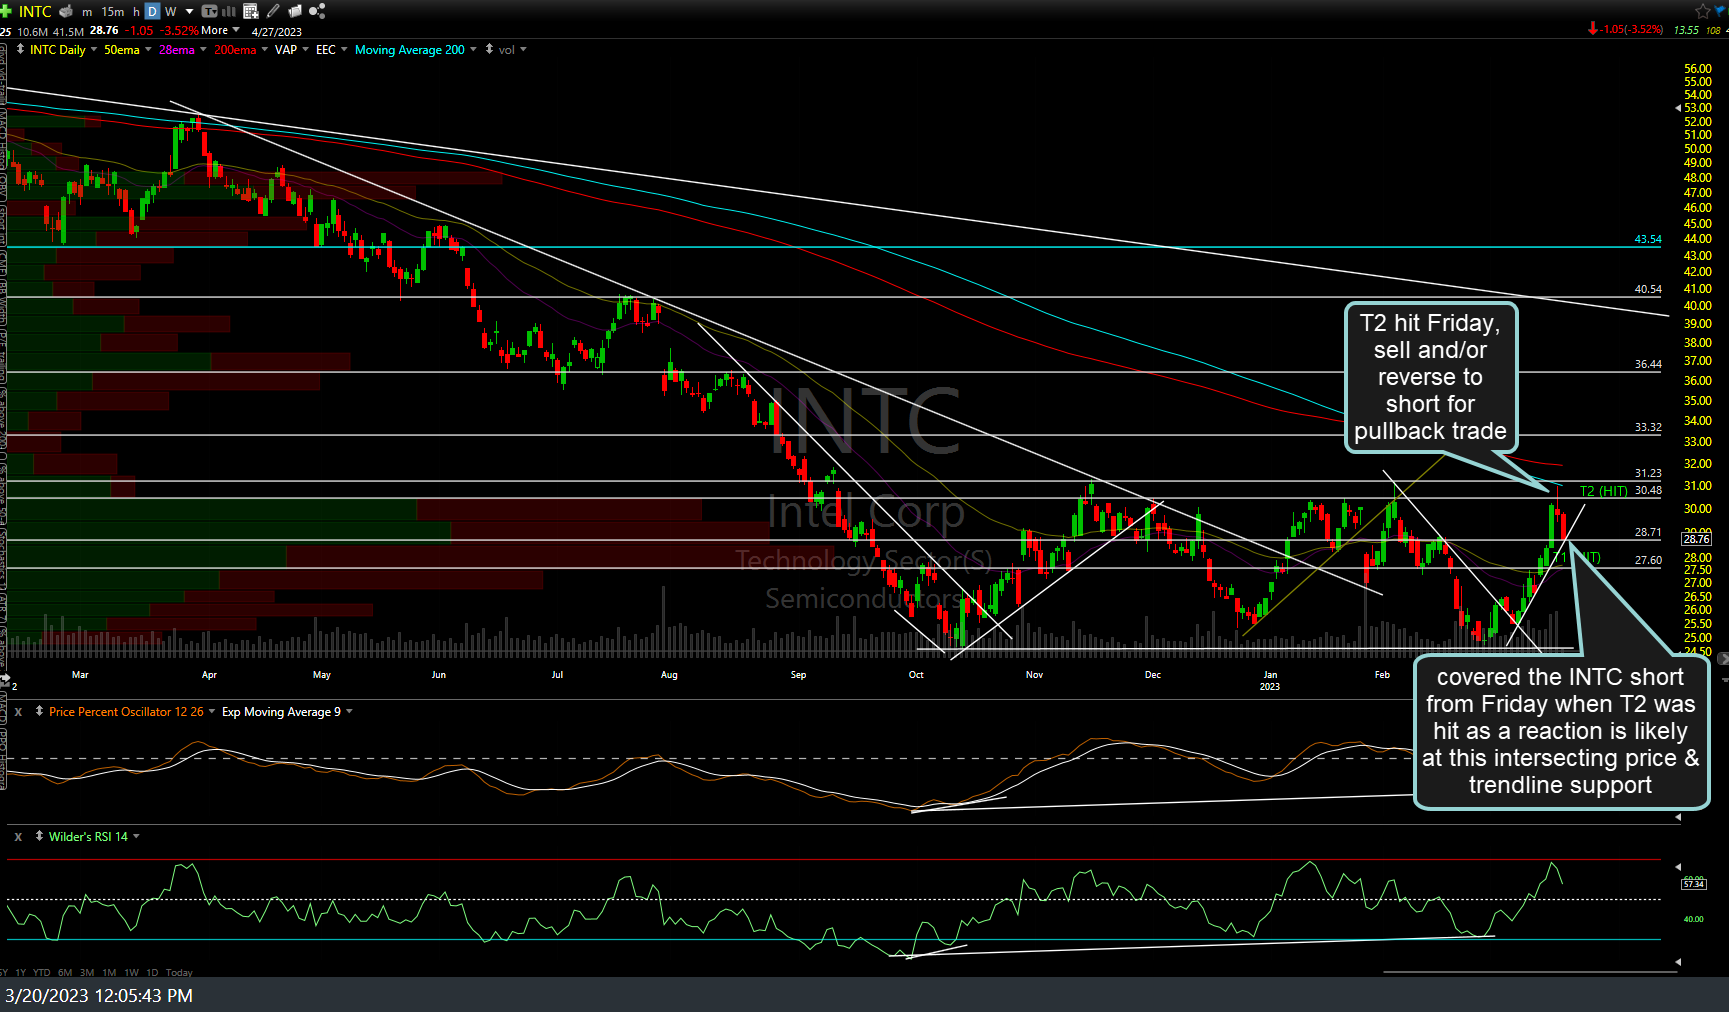
Daily chart above followed by the previous long trade entered right off the lows on March 1, 2023 the last time INTC had a similar technical posture (positive divergence at support).
Keep in mind that my job is to provide objective trade ideas, which this is based on the technicals noted above. However, with both the 10-yr Treasury bond as well as crude oil still solidly within my ORANGE ZONES, I will say that my degree of confidence on this trade panning out is much lower than that previous long last year (which was good for a quick 20% gain followed immediately by another 5%+ profitable short as we reversed (closed the long & shorted) INTC when T2 was hit. With that being said, INTC can either be taken as a pure-play long and/or an indirect hedge to an existing short position on SOXX.


