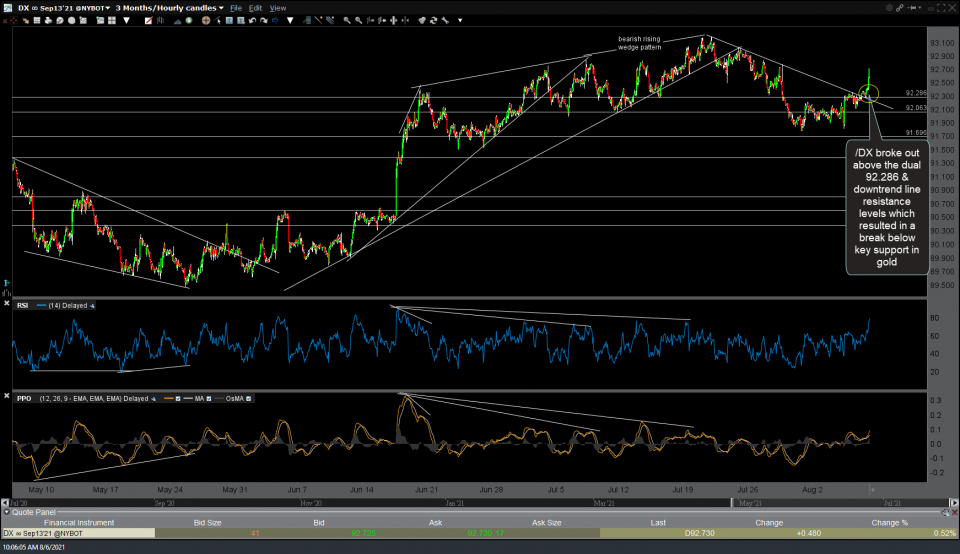
/DX (US Dollar futures) broke out above the dual 92.286 & downtrend line resistance levels that were highlighted in yesterday’s video which resulted in a break below key support in gold. 60-minute chart below.
The /GC (gold futures) & GLD (gold ETF) swing trade for active traders was stopped out on this solid break below the support/buy zone on the 60-minute chart which coincided with the breakout in the US Dollar.
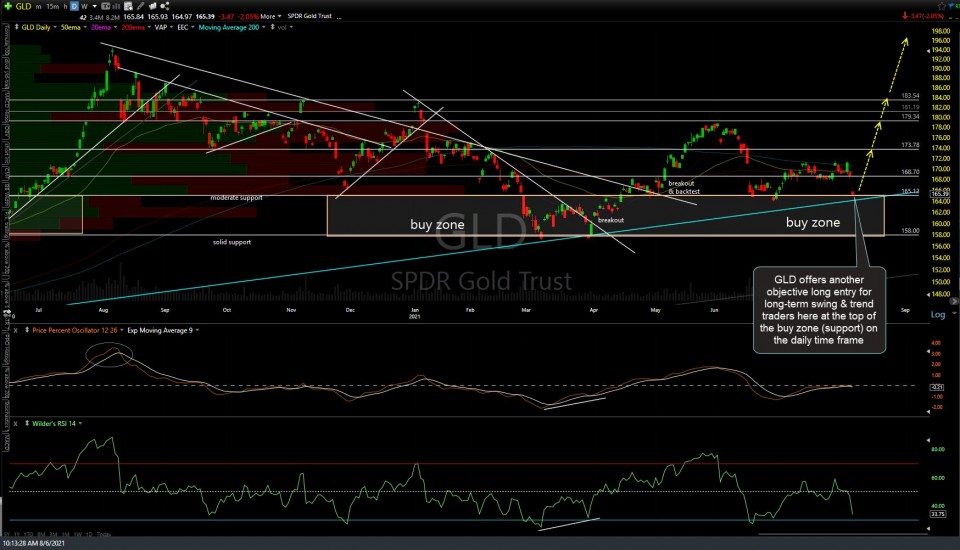
However, at the same time, gold also offers another objective long entry for long-term swing & trend traders here at the top of the buy zone (support) on the daily time frame. This is the same support zone that has been highlighted as providing objective long entries for months now, including the previous 52-week low back on March 8th (second chart below) & then again on the subsequent test of that level on March 30th. This is a good example of trading off multiple time frames, actively trading off the intraday charts & longer-term swing/trend trading off the daily & weekly charts.


