
One of my preferred trading proxies for Bitcoin is the GBTC (Grayscale Bitcoin Trust), which is similar to an ETF that tracks Bitcoin. GBTC has just recently broken below the key 12.22ish support level & appears to be bear flagging just below. Additionally, one of my favorite trend indicators, the PPO signal line (9-ema) is currently poised to make a bearish cross back down below the zero-line which would flip that trend indicator from bullish to bearish for the first time since the last bearish cross back in May 2018 (flipping back to bullish in late Feb 2019), should GBTC move much lower from here.
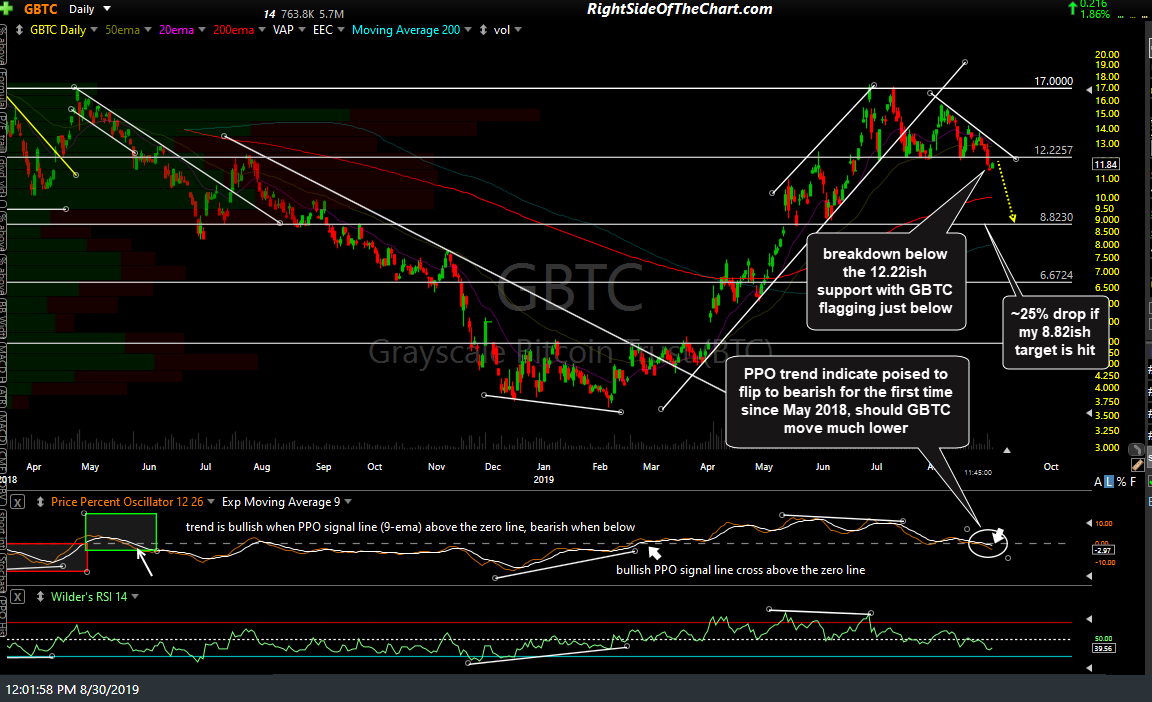
GBTC daily Aug 30th
However, as I often say, even if you only trade ETFs & ETNs that track a particular index, commodity or other security, such as Bitcoin in this case, you would be remiss not to put a higher emphasis on the charts of the futures contract as any buy or sell signal on the ETF would likely prove to be a whipsaw (false) signal if the futures don’t confirm the breakout.
/BRR is the CME CF Bitcoin Reference Rate, a futures contract that trades on the CMECRYPTO exchange tracking the price of Bitcoin. /BRR is currently perched precariously above the key 9450ish support level which has contained all pullbacks since that former resistance level was taken out with the impulsive gap above it back on June 14th. That 9454ish support on /BRR is comparable to the 12.22ish support on the GBTC chart above and a good example of why shorting the recent breakdown on GBTC could prove to be premature as the futures contract is still trading just above that comparable support.
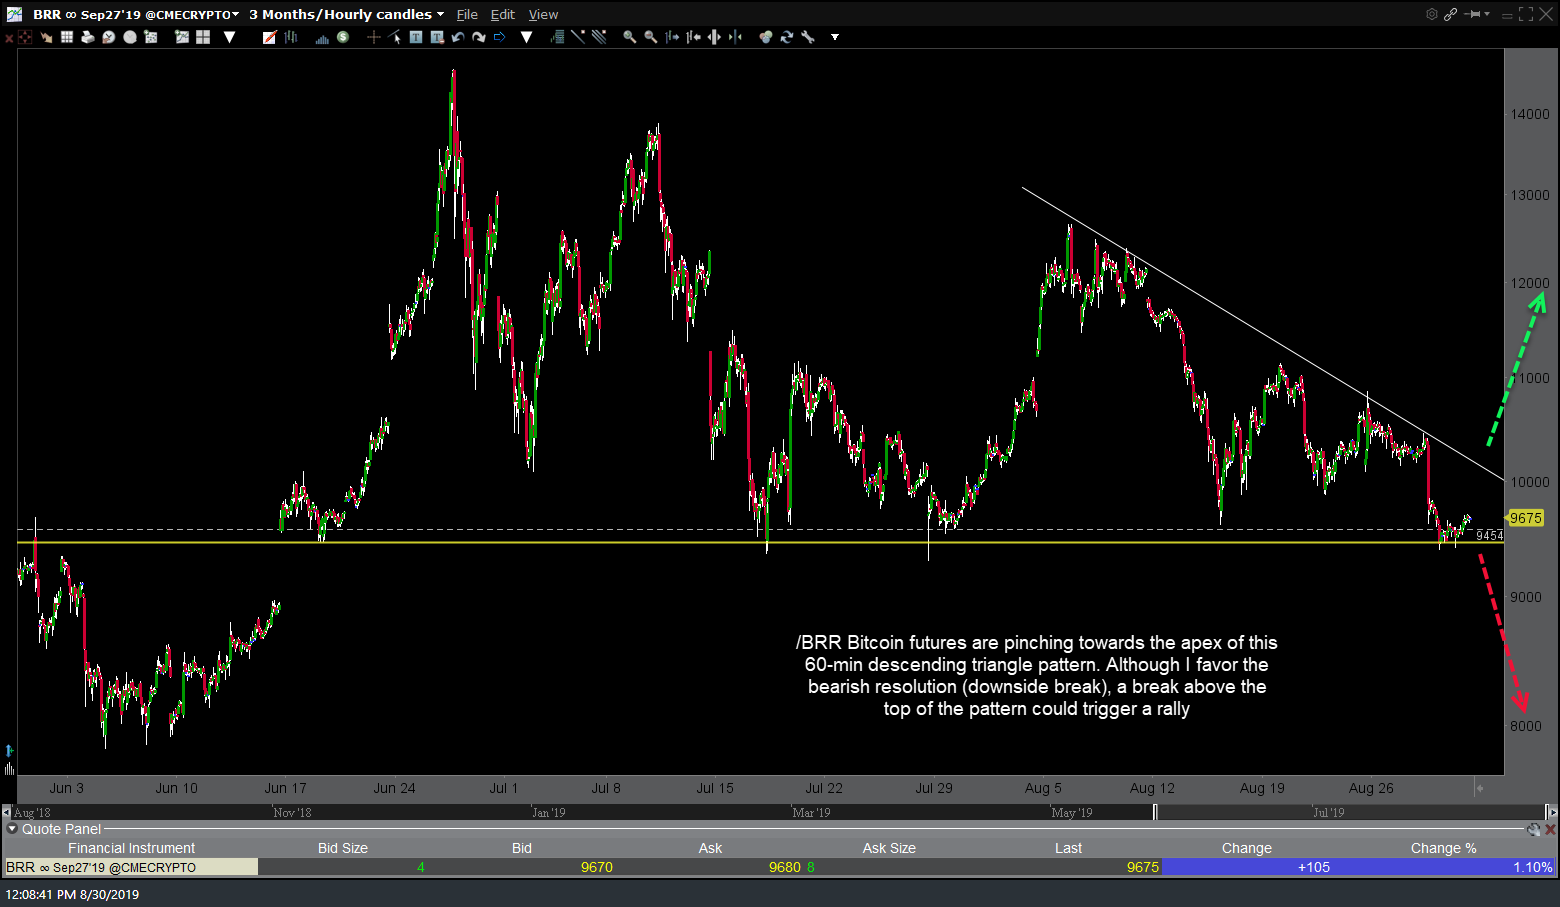
BRR 60-min Aug 30th
The 9450ish support level on /BRR forms a descending triangle pattern along with the downtrend line off the early August highs. Descending triangle patterns are inherently bearish technical patterns that often break to the downside although they can also break to the upside & if so, that is usually the catalyst for a tradable rally. My personal views, right or wrong, seem to be in a small minority which says Bitcoin was in a huge speculative bubble that burst back in late 2017 with the recent 2019 rally most likely just the first major bear market rally that has most likely just recently run its course with the next major leg down soon to come.
Again, I may prove to be wrong on my longer-term outlook but either way, I can say that /BRR appears to be in a fairly well-defined descending triangle pattern on the 60-minute time frame & as such, would offer either an objective short entry with a sell signal to come on an impulsive breakdown below the 9450 level or an objective long entry (although personally, I would pass due to recent bearish developments on the daily chart) on an impulsive breakout above the top of the pattern/downtrend line.
I am going to add GBTC as a Short Trade Setup but I’m holding off on providing an official entry (sell trigger) for the trade at this time as I’d like to see what happens with both Bitcoin as well as the broad market once trading resumes after the upcoming 3-day weekend. If I don’t get around to adding this as an official trade, for those that decide to short GBTC, I can say that I would add a first target around the 11.00ish support level (not marked on the chart above) with a second target set just above that 8.82ish support level with the potential for additional targets to be added, depending on how the charts develop going forward.
Likewise, price targets for a long trade taken on an impulsive breakout above the pattern would be set just below the 14.14ish resistance level (not shown on the chart above) and then the 17.00 level.