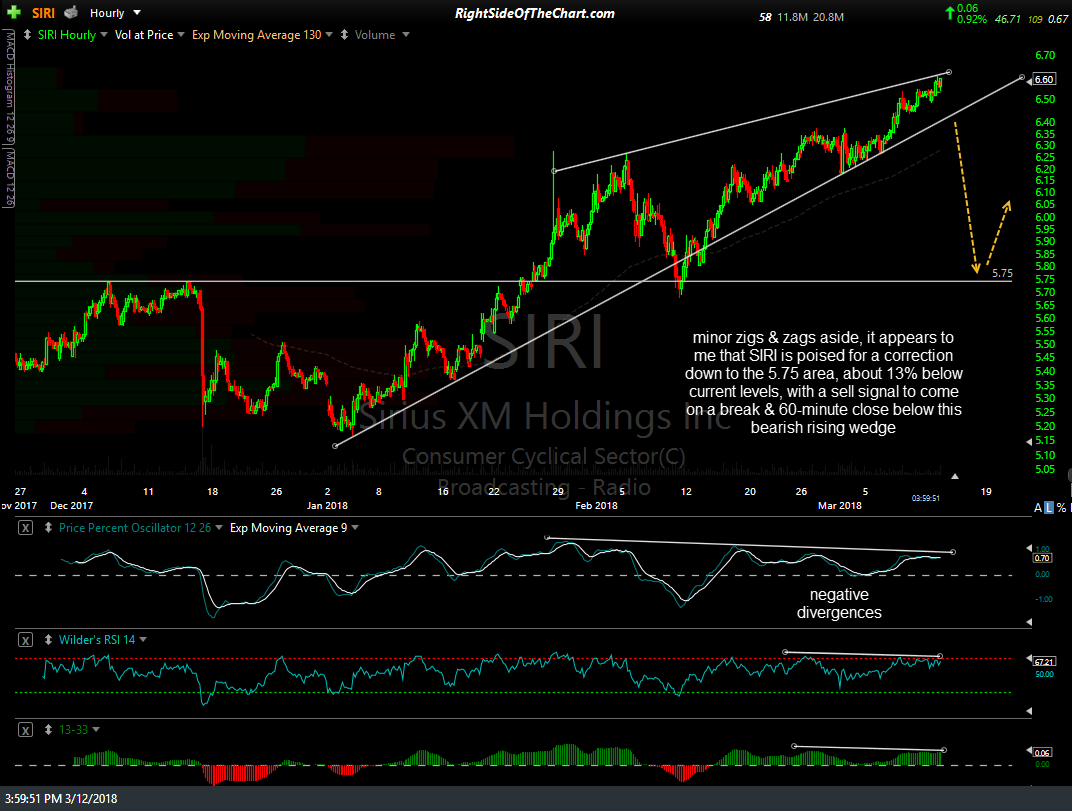
Member @getlucky asked for my thoughts on SIRI (Sirius XM Holdings) in the trading room. As the charts seem pretty clear as to the next major trend in the stock, which I might also add as an official trade idea soon, I figured that I would share my reply here on the front page for all to see. Minor zigs & zags aside, it appears to me that SIRI is poised for a correction down to the 5.75-5.80 area, about 12-13% below current levels, with a sell signal to come on an impulsive breakdown and/or close below this bearish rising wedge pattern.
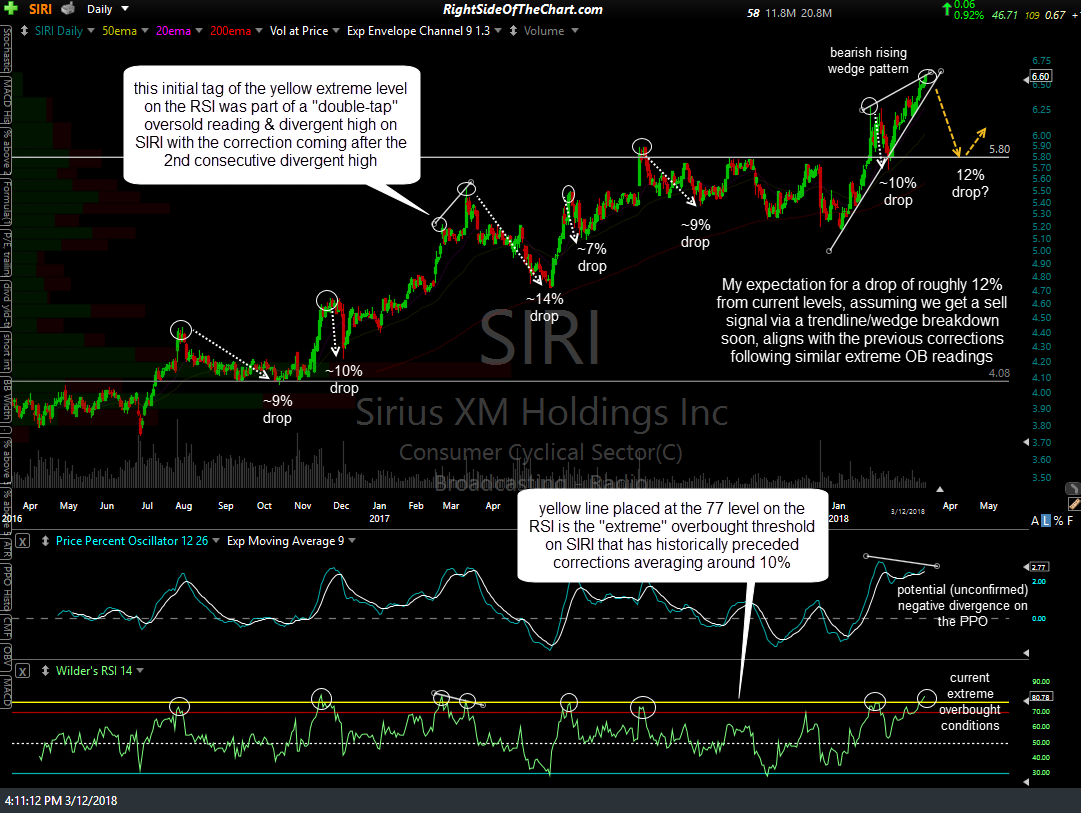
On the daily chart below I’ve added a yellow horizontal line around the 77 level on the RSI. Typically, any reading of 70 or more is considered overbought on a stock but some stocks tend to become more overbought than others. As such, I’ll add a line like this which indicates extreme overbought conditions on that particular stock to use in my analysis vs. the more commonly used overbought readings at the 70 level.
As highlighted by the circled areas, you can see that corrections averaging around 10% have followed such extreme overbought readings in all but one instance in recent years. That one exception was initial tag of the yellow extreme level on the RSI in February 2017 which was part of a what I refer to as a “double-tap” oversold reading which resulted in divergent high on SIRI with the correction coming after the second consecutive divergent high. I use the term “double-tap” readings when they come in close promity vs. the typical oversold readings which are usually spaced several months or more apart.


