
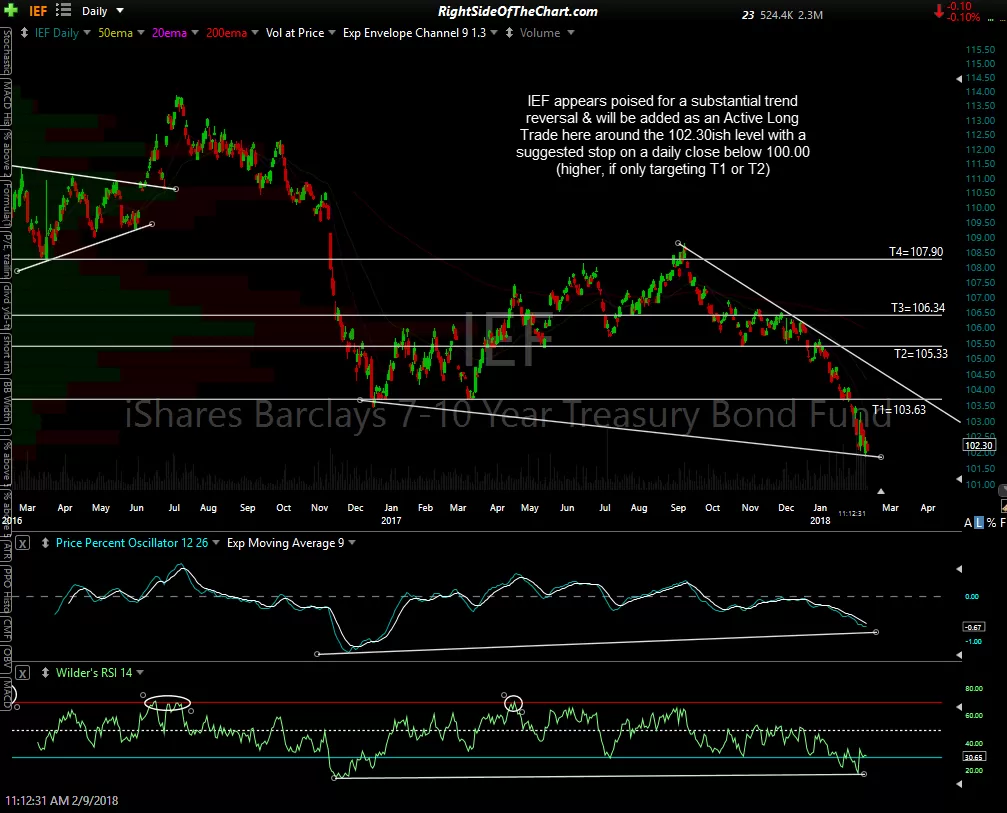
IEF (7-10 year Treasury Bond ETF) appears poised for a substantial trend reversal & will be added as an Active Long Swing Trade as well as a Growth & Income Trade here around the 102.30ish level with a suggested stop on a daily close below 100.00 (higher, if only targeting T1 or T2). Price targets are T1 at 103.63, T2 at 105.33, T3 at 106.34 & T4 at 107.90. Due to the relatively low volatility of short-to medium term US Treasury bonds, the suggested beta-adjusted position size for this trade will be 2.0 (2x a typical swing trade position size).
-

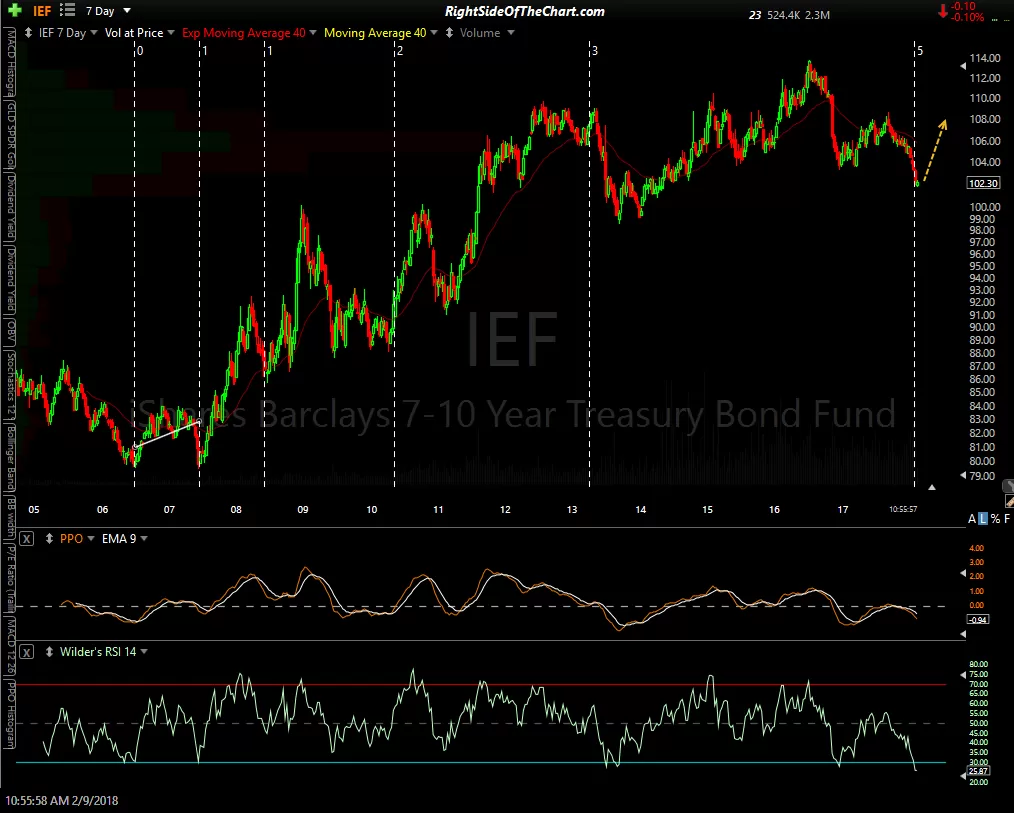
- IEF daily Feb 9th
-

- IEF 60-min Feb 9th
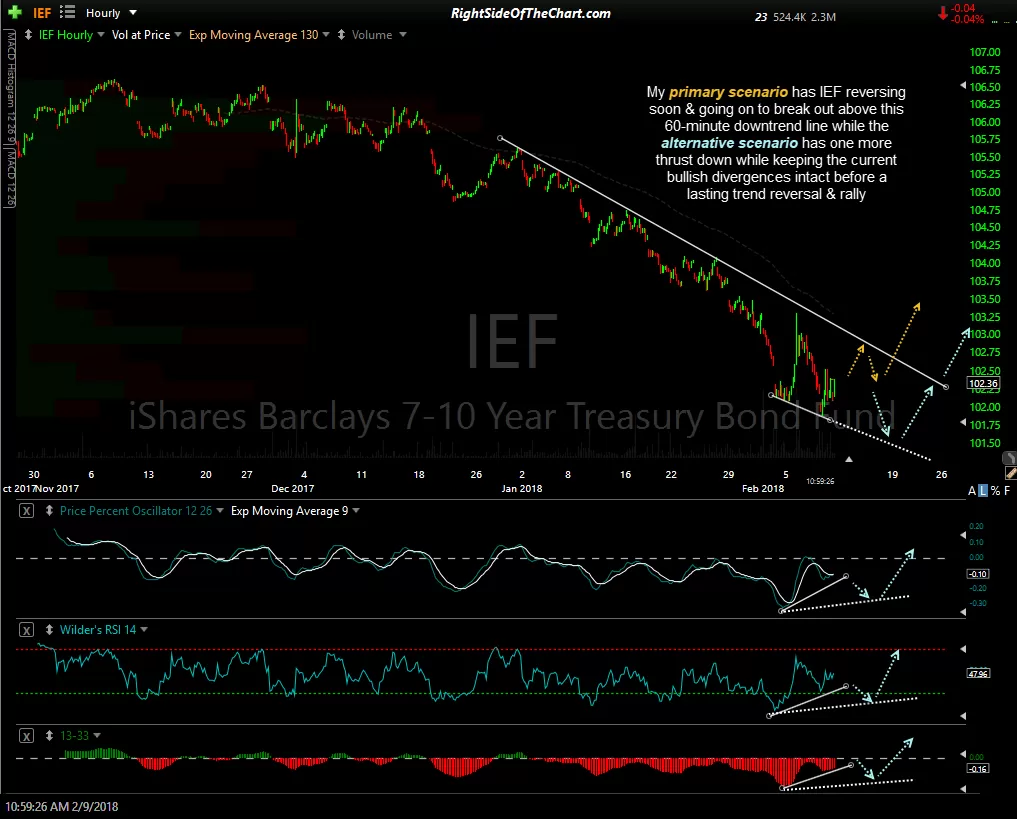
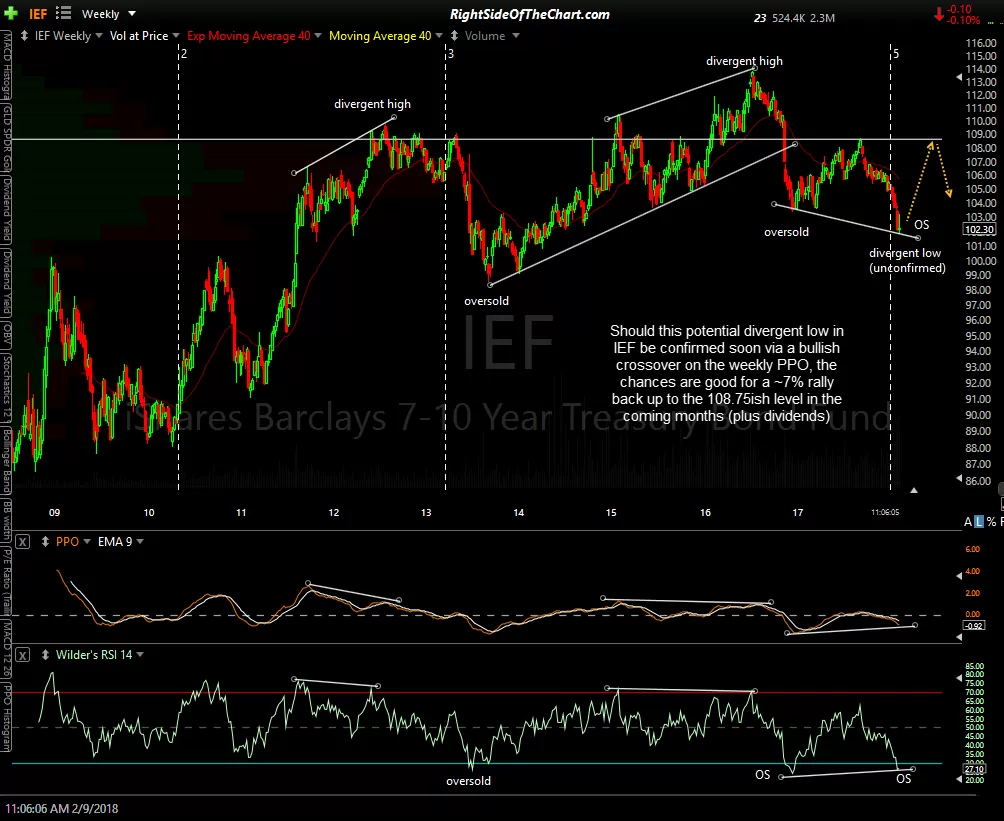
On the 60-minute chart above, my primary scenario has IEF reversing soon & going on to break out above this 60-minute downtrend line while the alternative scenario has one more thrust down while keeping the current bullish divergences intact before a lasting trend reversal & rally. The first chart below is a 10-year weekly chart. Should this potential divergent low in IEF be confirmed soon via a bullish crossover on the weekly PPO, the chances are good for a ~7% rally back up to the 108.75ish level in the coming months (plus dividends).
-
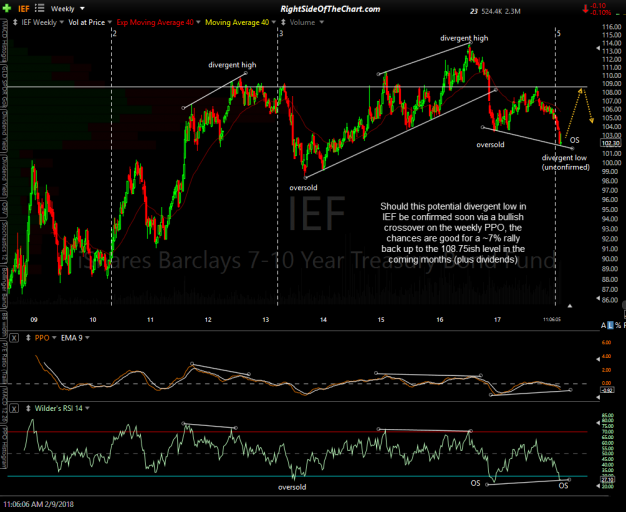
- IEF weekly Feb 9th
-

- IEF 13 yr Fib Time Zones Feb 9th
The second chart above is a 13-year chart overlaid with Fibonacci Time Zones with the initial point placed at the major reaction low from 2006 & the next point at the subsequent major reaction low in 2007. The rest of the lines are automatically spaced based on the Fibonacci sequence (each number is the sum of the two previous numbers in the sequence). Fibonacci time zones can help to identify major inflection points as so far has been the case with the Fib time zone that I’ve been tracking on this chart for several years now. As the trend leading up to this most recent time zone line (5) has been a downtrend, should this pattern continue to play out then one would expect a significant bottom in IEF from at or near current levels.
Besides the technical case for a trend reversal in the 7-10 year Treasury bonds made above (oversold, bullish divergences, etc..), from a fundamental perspective, should the broad market continue to experience volatility & especially if they continue to move lower in the coming weeks & months, treasury bonds are likely to benefit from a flight-to-safety bid as individual investors & institutions pull money from stocks to place in the relative safe haven of US Treasury bonds.
Based on my analysis of the chart, my preference is the medium range maturity bonds at this time as short-term treasury prices are likely to remain under pressure if the Fed continues on their planned course of raising short-term rates while longer-term (20-30 year) treasuries are more interest sensitive than the 7-10 year bonds plus I’m not as keen on the technicals of TLT (20+ year treasury ETF) and $TYX (30-year treasury yield index).