
This daily chart of IWM shows all divergent highs for the last 3 years, every one of which was followed by a significant pullback or correction & even a bear market with IWM falling over 27% off the June 2015 highs into the early 2016 lows. Despite what may appear to some as a bullet-proof uptrend, I struggle to find any reason why this most recent divergent high (assuming it is confirmed via a bearish crossover on the MACD while the before all 3 of these indicators move back above their late December highs) won’t play out as the previous divergent highs have in the past. Also note that many of the larger divergences, those that were followed by the largest corrections, were often comprised of a series of smaller divergent highs, each resulting in mild or moderate pullback in the small caps.
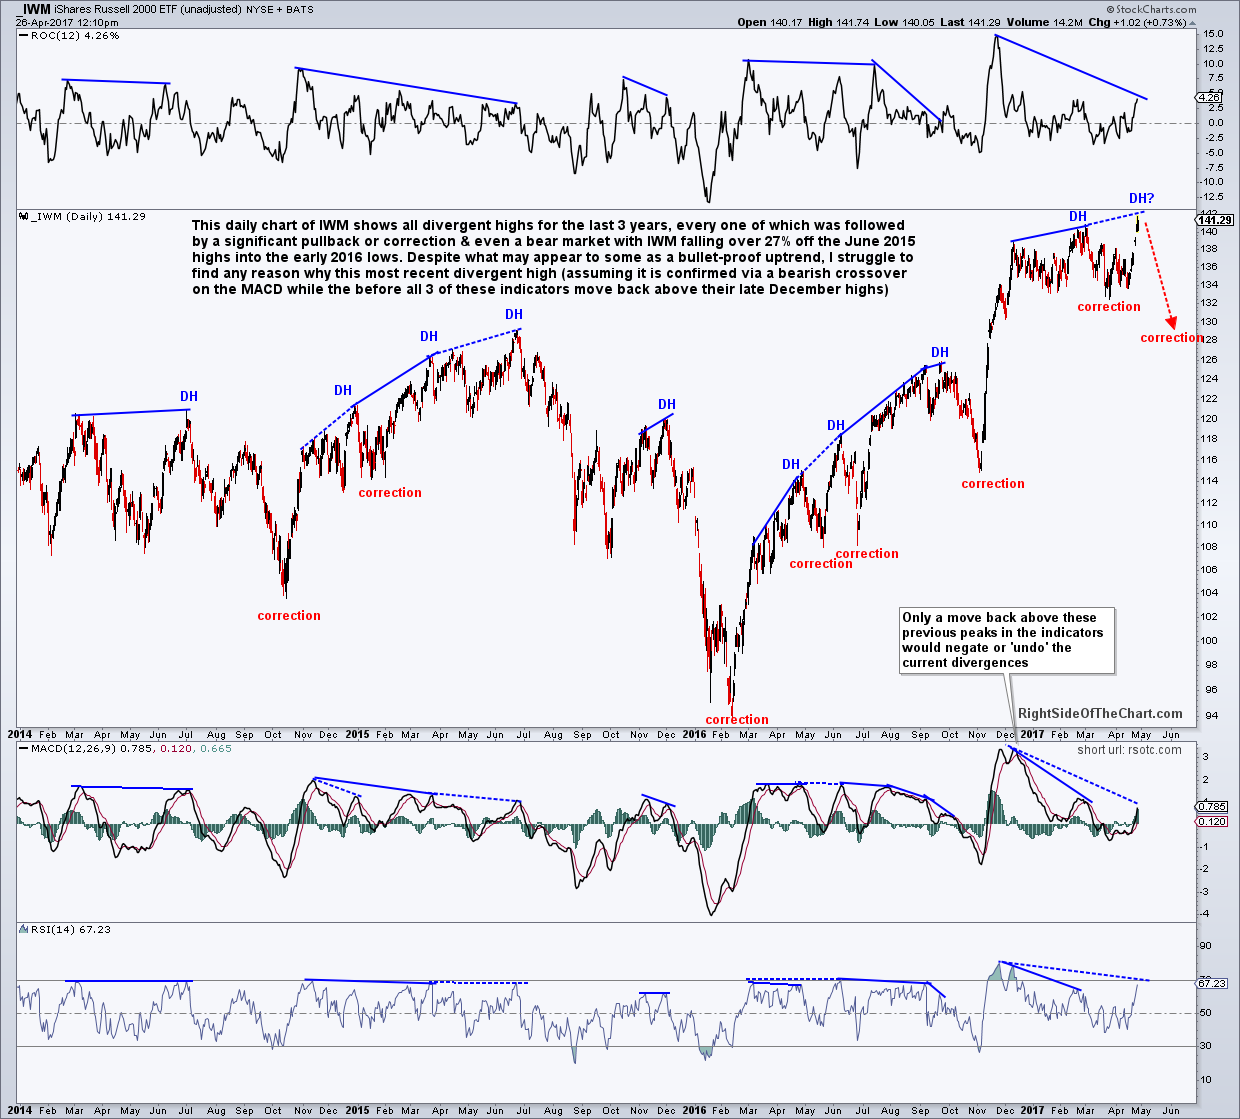
IWM daily April 26th
All 9 out of the previous 9 divergent highs in IWM were followed by tradable corrections right after the divergence was confirmed (via the bearish crossover on the MACD which forms a lower low on that indicator). As discussed in last’s night video covering the history of divergences on the Nasdaq 100 and S&P 500, the divergences themselves are not sell signals, merely a warning sign that an impending trend change is likely. As such, it’s hard to say exactly when the current divergences will begin to manifest in the form of a correction or even if they will at all. However, based on how severely all three of these indicators are lagging behind their previous peaks from late December, as well as the clear history of corrections that followed all such previous divergent highs in recent years, I would put the odds very close to zero that the Russell 2000 index will continue to rally to point in which these divergences are negated, or taken out, by taking those indicators back above those previous highs before a decent correction occurs & the divergences are “confirmed”.