
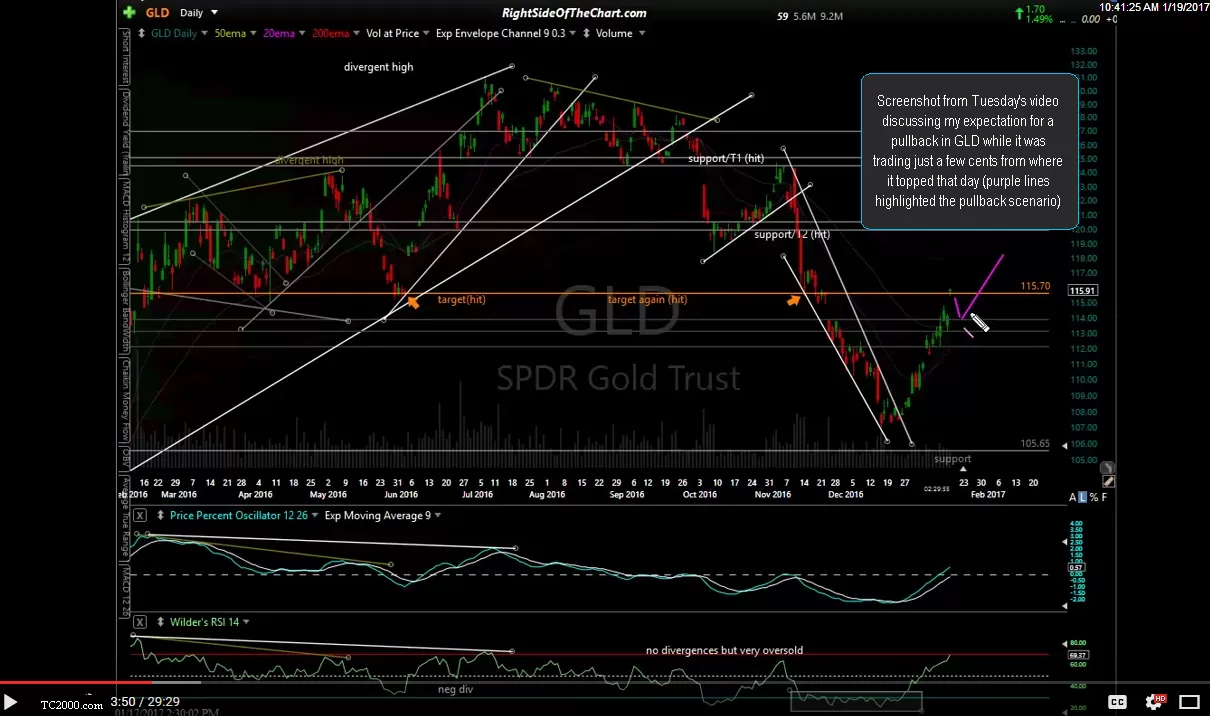
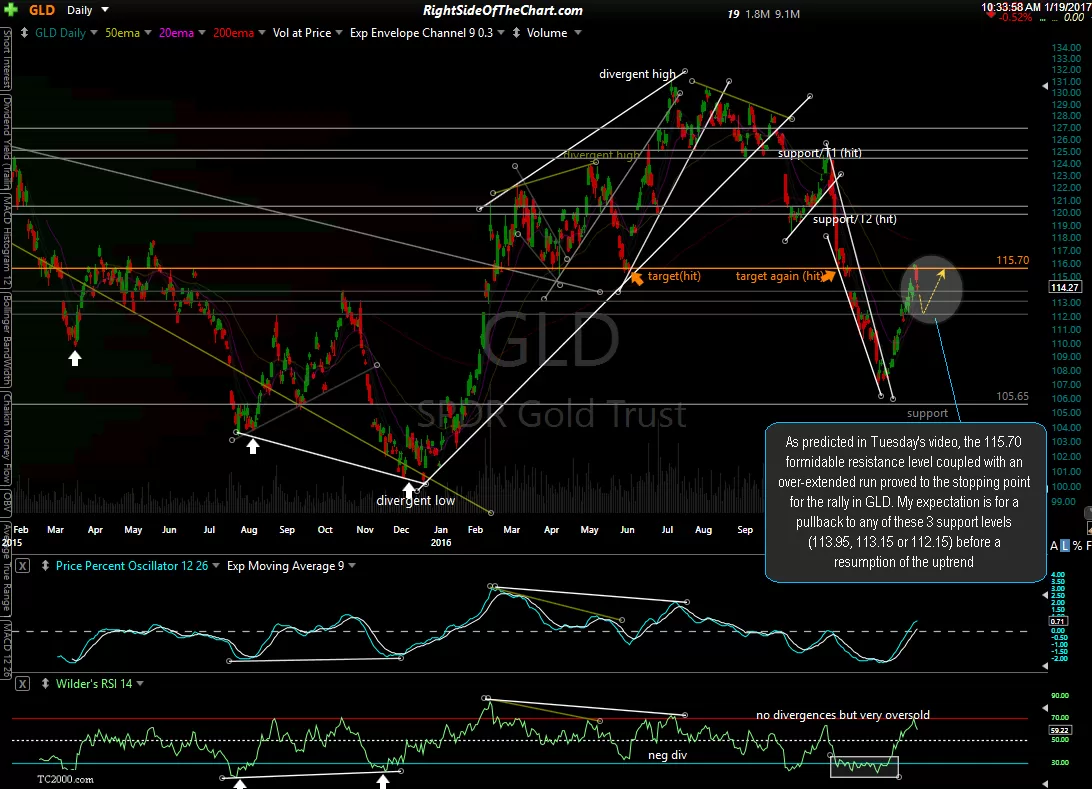
As predicted in Tuesday’s video, the 115.70 formidable resistance level coupled with an over-extended run proved to the stopping point for the rally in GLD. My expectation is for a pullback to any of these 3 support levels (113.95, 113.15 or 112.15) before a resumption of the uptrend. The first chart is a screenshot taken from Tuesday’s video discussing my expectation for a pullback in GLD while it was trading just a few cents from where it topped that day (purple lines highlighted the pullback scenario) followed by the updated chart showing that the first of 3 potential pullback targets/support levels (113.95) has now been hit. As such, a minor reaction off this level is likely although I’m leaning towards another thrust down towards either or both of the next two support levels at this time.
-

- GLD video screenshot from Jan 17th
-
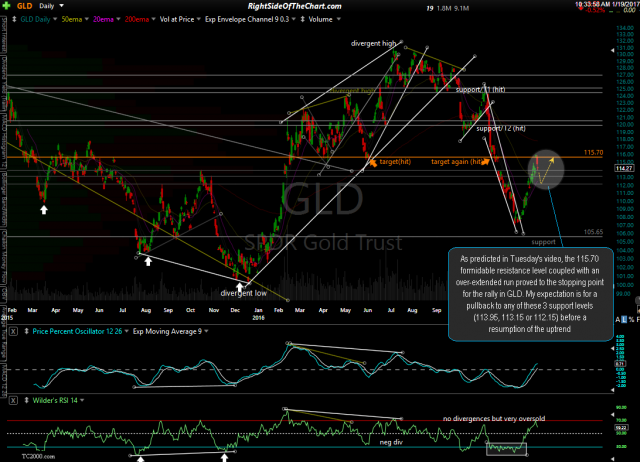
- GLD daily Jan 19th
During Tuesday video I has stated closing my GDX position since the risk/reward for gold & the miners was clearly skewed to the downside at that point. Although GDX reversed off minor support so far today, following the recent divergent high coupled with my outlook for gold, I favor a continued move down to any or all of these support zones, any of which could prove to be an objective level to add back long exposure, assuming the charts confirm if/when GDX gets there.
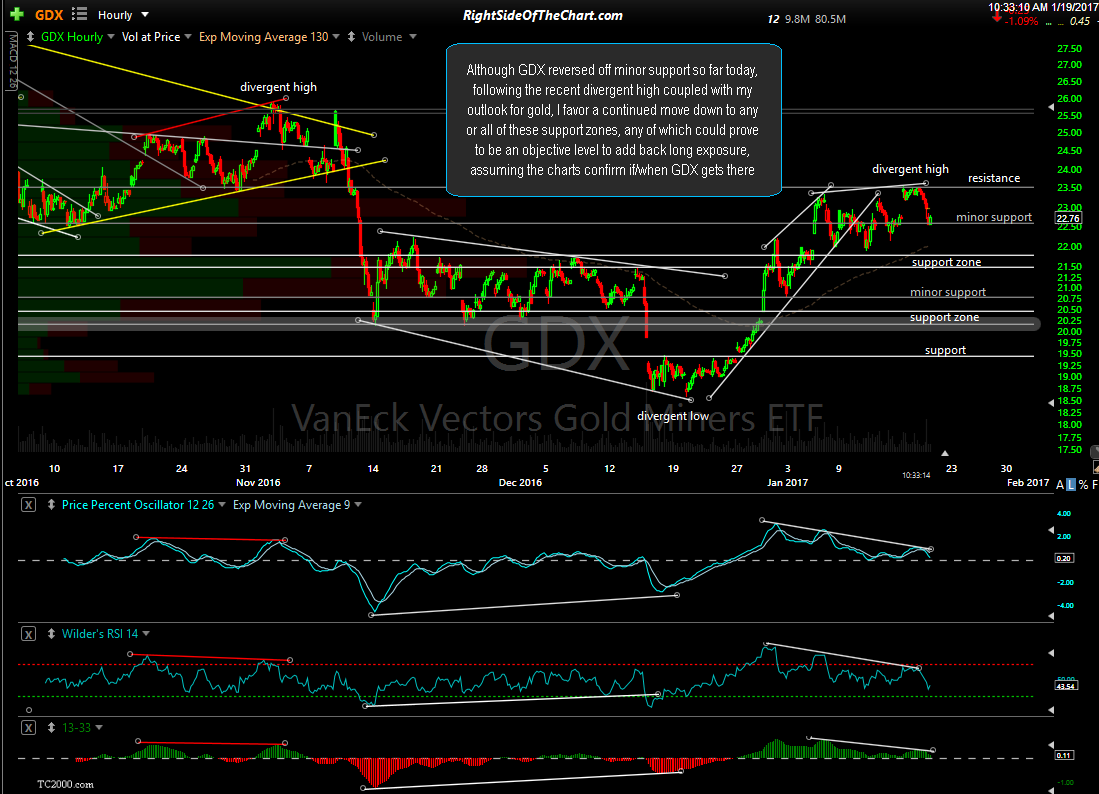
GDX 60-minute Jan 19th
To clarify that statement, just because a security falls to support does not mean that it is an objective time to go long. In order to make a decent case for a long entry, I would prefer to see some evidence of a likely reversal, such as bullish divergences or trend indicators flipping from bearish to bullish on the intraday charts. I will continue to update any significant developments in gold & GDX going forward.