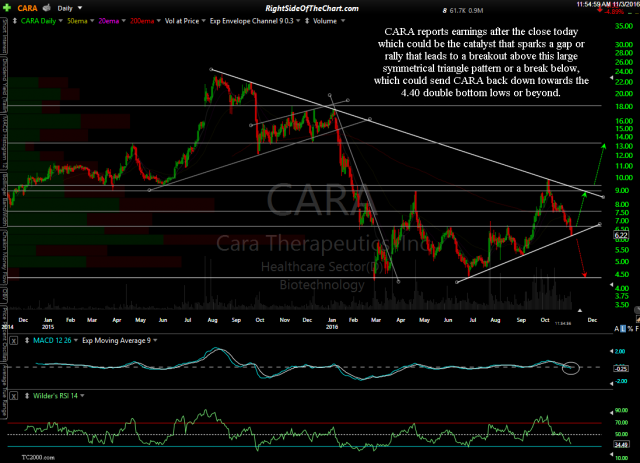
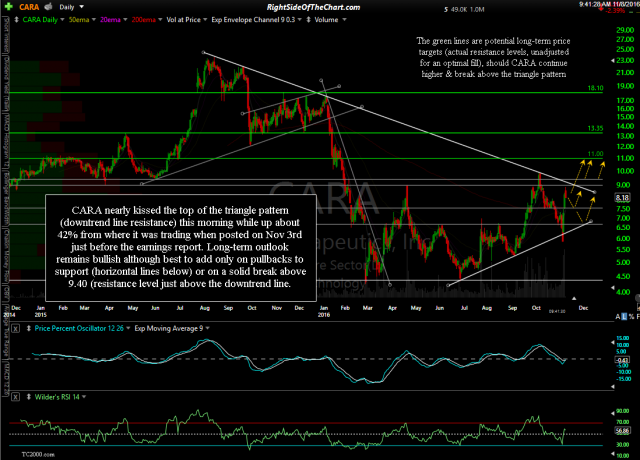
CARA (Cara Therapeutics Inc) nearly kissed the top of the triangle pattern (downtrend line resistance) this morning while trading up about 42% from where it was trading when posted on Nov 3rd just before the earnings report. Long-term outlook remains bullish although best to add only on pullbacks to support (horizontal lines below) or on a solid break above 9.40 (resistance level just above the downtrend line). Still an unofficial trade idea for now although I wanted to post the update as several in the trading room have posted being long and/or taking CARA on the earnings play. Previous & updated daily charts:
- CARA daily Nov 3rd
- CARA daily Nov 8th


