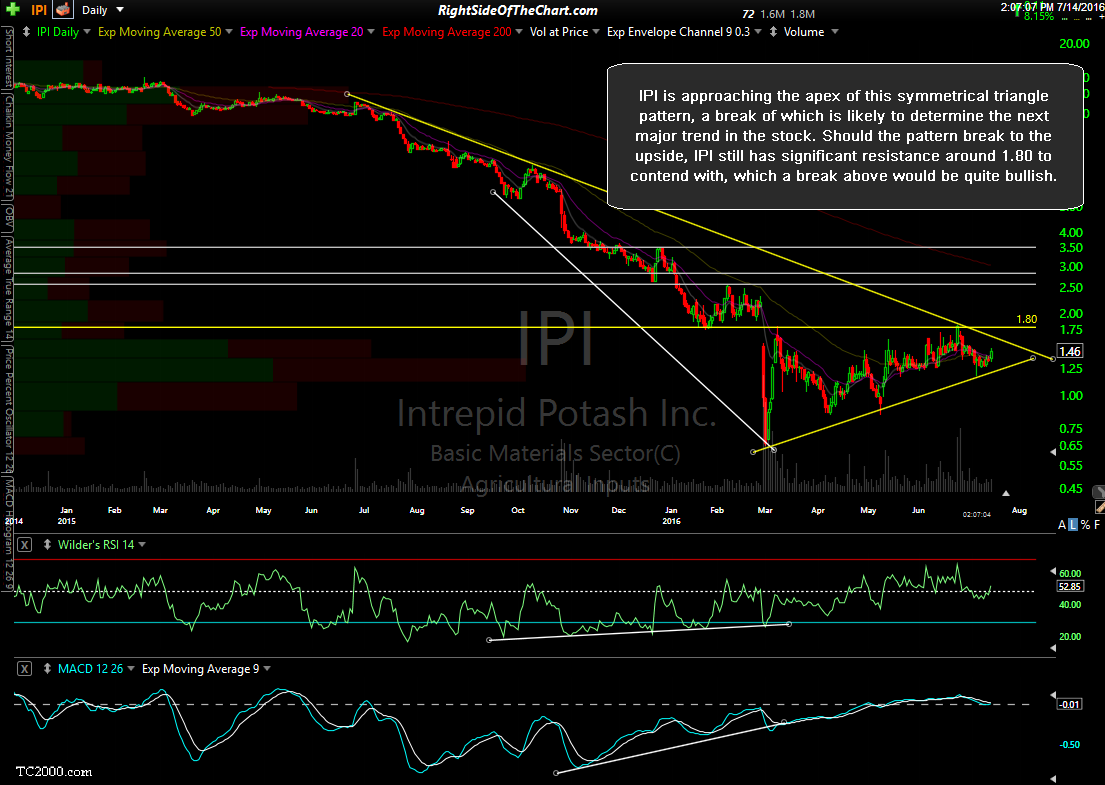
Member @ddodd100 mentioned IPI in the trading room and as there are some significant levels worth noting, I figured that I’d share my thoughts along with the chart. I looked at IPI earlier today in reviewing the biggest gainers on one of my watch-lists with the stock trading up about 8% today although keep in mind that such a move is not uncommon with such a low-priced stock (currently trading at 1.46).
IPI (Intrepid Potash Inc) could be pounding out a bottom here but still has a pretty significant resistance level around 1.80 to clear. Add to that, from the look of the weekly MACD & RSI (note, only the daily chart is shown above), IPI might need to take one more thrust down before putting in a lasting bottom. The only problem with that is it would likely take it below the important 1.00 level once again, a precarious technical level as stocks that trade below 1.00 for too long run the risk of being delisted.
The yellow lines (symmetrical triangle plus 1.80 horizontal) are the key levels IMO. A break above the downtrend line could spark a rally (but I’d still wait until 1.80 goes before taking a full position) while a break below the uptrend line could trigger another leg down in IPI. I’ll try to keep an eye on it but don’t hesitate to drip on me for an opinion the the stock in the future. As of now, I wouldn’t consider a long unless it clearly took out 1.80 with conviction (above avg. volume and/or impulsive buying).


