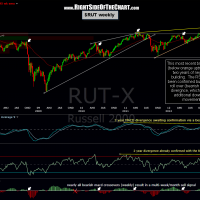
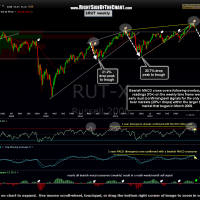
Posted below is the updated $RUT weekly chart preceded by the previous $RUT weekly chart that was posted two weeks ago today. In that previous chart, I had noted how I was waiting for confirmation of the negative divergence that had been building over the last two years. The confirmation that I was waiting for was a bearish crossover on the MACD, which we did indeed get last week and so far this week, the MACD has continued to fall further below the signal line which helps to solidify that sell signal. At the time I had pointed out the fairly reliable history of bearish MACD cross-overs on the weekly time frame as a stand-alone sell signal. However, as this updated chart illustrates, these weekly MACD sell signals can also be used a confirming sell signal following the aforementioned weekly overbought (RSI 70+) sell signals.
As often discussed, overbought on a weekly time frame is not a sell signal in itself. In fact, it is not uncommon to see an index or sector move into overbought territory and remain there for weeks while prices continue higher. Typically, the sell signal comes once the RSI has crossed back below the 70 level and/or backtests that level from below. However, in technical analysis, many buy and sell signals can be improved upon by using a second, confirming signal. If we look at the updated $RUT weekly chart above, you can see that the small caps actually had two bear markets (20%+ drops) within the larger bull market that began back in March 2009. As the highlighted circled areas show, this weekly RSI-MACD crossover dual sell signal triggered in the very early stages of those corrections. Again: The first signal is a cross of the weekly RSI back below the 70 (overbought) level followed by the second (confirming) signal of a bearish MACD crossover, which is best viewed using the MACD histogram.
As a side note, these same “dual sell signals” can be applied to the $SPX and most other diversified indices. Currently, the $SPX weekly chart has triggered the RSI sell signal but has yet to confirm via a bearish MACD crossover. However, with the MACD line having recently turned down and the histogram now below a reading of 3, any additional sideways action or downside movement over the next week in that leading large-cap index will almost certainly trigger that confirming signal as well. I know this market fells like it will never go down again and maybe it does manage to continue to build on it’s gains for another few weeks or months. However, I’m watching many different recently sell signals on both the broad markets as well as leading stocks such as AAPL, XOM, and the TBTF bank stocks. By my interpretation, the recent technical breakdowns and/or sell signals in these key stocks and indices are still intact or close to triggering (as in the case of the $SPX). However, any significant additional upside in the markets from current levels will begin to rapidly negate these sell signals/breakdowns and therefore, the market needs to reverse very soon, lest the bearish scenario will begin to rapidly diminish.


