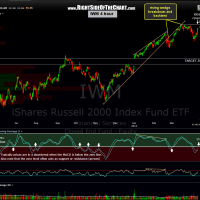
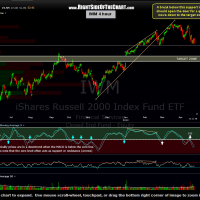
 As this 15 minute period chart highlights, IWM has significantly underperformed all other key US indices since the IWM short/TZA long entry back on March 22nd. In fact, IWM is down 5% while all other key US indices are basically flat to slightly lower. Also included below is the updated 4 hour chart of IWM preceded by the string of previous 4 hour charts posted with this trade. If things continue to play out as expected, then a break below the 88.80ish support level shown on these 4 hour charts will likely be the catalyst for a relatively quick plunge down to the initial target zone. I also plan to add some additional downside targets soon for those looking to extend this trade into a potential longer-term swing short on the small caps. 4 hour charts below:


