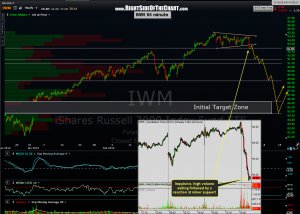
 Remember, minor support (and resistance) levels are levels where a reaction is likely (reaction= a temporary pause or relatively minor bounce). Most swing traders shouldn’t be overly concerned with these levels unless looking to take partial profits or possibly even to add to an existing position (once a minor support level breaks). More active traders might find these levels useful in micro-managing a trade (e.g.- reversing short to long for an intraday bounce before going short again). If so, one should always use the shorter-term (1, 5, 15 minute, etc..) charts to confirm the likelihood and potential scope and duration of any bounce off these minor support levels.
Here’s the updated 60 minute chart of IWM with the dashed lines showing the most likely “route” to the IWM/$RUT short downside target. Although not reflected on this chart, IWM has bounced off that first support level in the last few minutes and as dashed lines indicate, my expectation is that this bounce will be relatively short-lived. For anyone looking to add onto the IWM short/TZA long, it would be best to wait for today’s LOD in IWM (92.79) to be taken out first.

