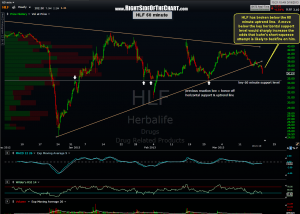
 On the last update to the HLF short trade, I had pointed out this triangle pattern on a 120-minute time frame chart stating that a downside resolution to the pattern was likely. Prices have indeed recently broken to the downside and I have added one additional key support level to watch as shown on this 60 minute chart.
My thoughts on HLF continue to be that there is a good chance, contrary to the widely held consensus on Wall Street, that Carl Icahn’s short-squeeze plan, which relies primary on the use of options, might backfire on him. If so, the unwinding of his positions, coupled with both natural and new short-selling of HLF shares, could be the recipe for a very powerful move down in the stock. This is pure speculation and I must reiterate that this is a very aggressive trade that could move sharply in either direction at any time so as always, DYODD and trade (or don’t trade) according to your own risk tolerance, trading style and objectives. T3 (31.30), which can be viewed on the recently posted daily charts, remains my final and preferred target for now but additional target may be added to this trade soon. As of now, suggested stops remain on a solid move above the top of this pattern.

