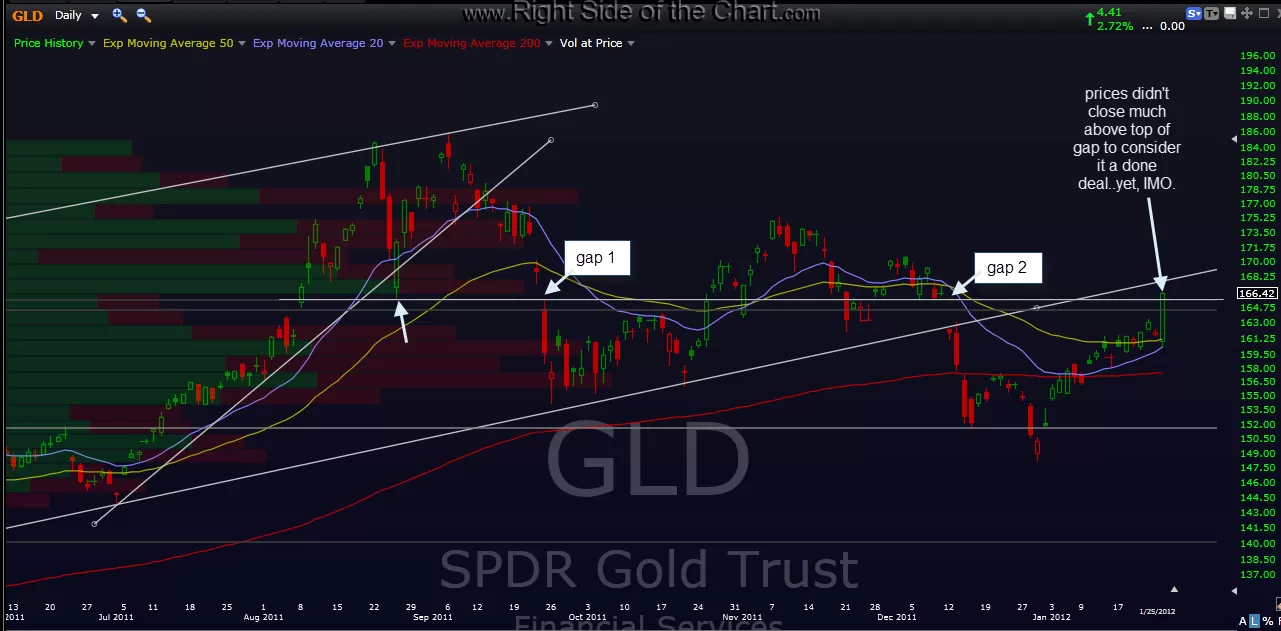
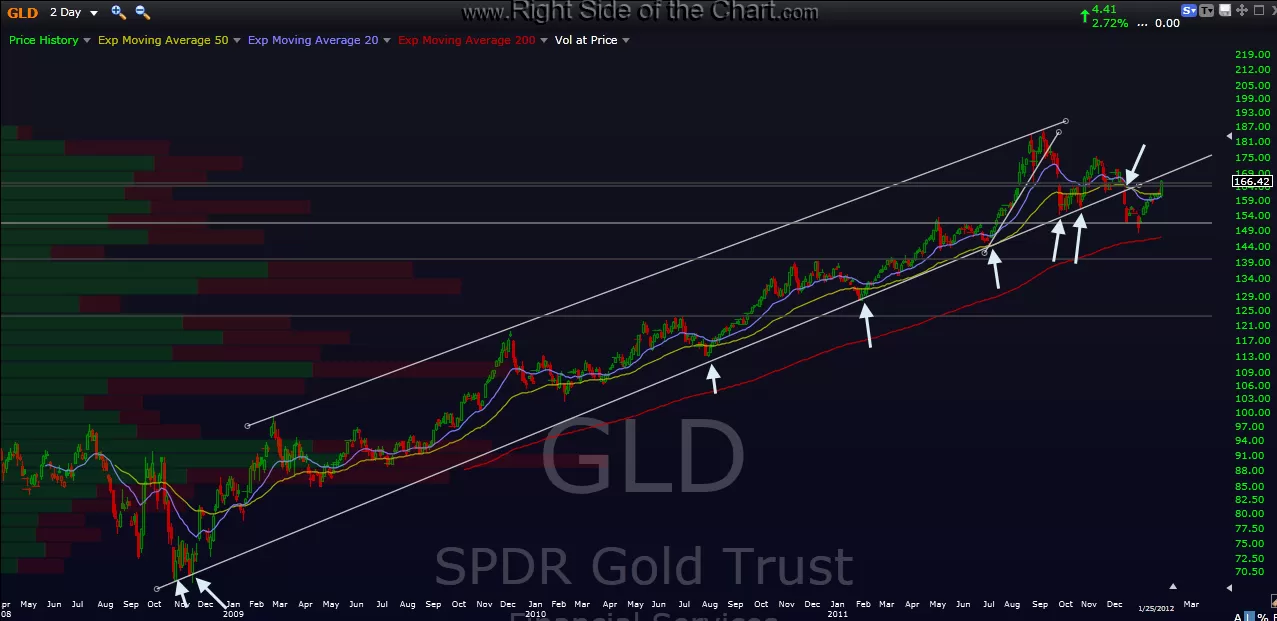
just to clarify regarding the GLD charts i posted earlier, here is that daily uptrend channel that i am focusing on. the first chart is a two-day period (each candlestick represents two days of price moves). the arrows mark the tags of the uptrend line, which IMO, make it a pretty valid trendline. the next chart is just a zoom-in of the daily chart showing where GLD is in relation to both re-testing the bottom of that channel (not very far) as well as horizontal resistance, as per the two recent gaps marked on the chart.
of course, a bounce to resistance is not in-itself automatically a reason to short. using other indicators and time-frames will help determine if prices are likely to pull-back from that support or bust through it. my opinion on a pullback is not very strong at this point, however, i do think that the odds favor at least pullback from at or near current levels (possibly a much larger move lower toward my weekly target). being that GLD has a little room to go before actually testing the bottom of that channel, prices could drift higher for a few days before a pullback begins. of course, a lot can and probably will happen over the next few days, both in stocks and gold so either a quick hit-n-run strategy for the nimble traders or continuing to keep things light for now might just be the best strategy for the time being. i will always continue to post both bullish and bearish candidates as i see them, regardless of my own personal views or bias on the market (and please… don’t ever believe a trader who tells you that he/she trades the market without any bias, unless you are talking to one of Goldman Sach’s HFT computers….).