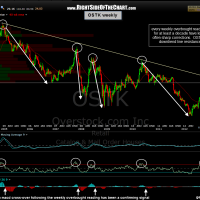
OSTK looks like a nice long-term swing short opportunity and I am adding it as an active short trade here at current levels (14.23). This weekly chart speaks volumes to me: First off, OSTK has made an impressive, but over-extended rip right up to a primary downtrend line generating from the stocks’s all-time high back in Dec. 2004. Note how every single overbought reading on this weekly chart (nearly a 10 year span) has been followed by a very substantial correction. Typically, it is the move back down below the 70 (overbought) level that confirms a sell signal when incorporating the RSI into your analysis. As you can see, the weekly RSI is currently poised to break below that level on any addition downside or even sideways trading in the stock.
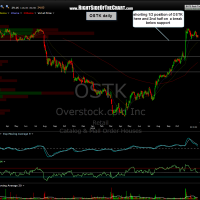
A second confirming signal in the past has been a bearish MACD cross-over (also shown on the weekly chart). I have included the daily chart as well listing the targets and a support level which is not too far below current prices. As this trade is based primary off the weekly chart, I would consider scaling in or using a small enough initial position size to allow for a relatively wide stop. Stops would be on a SOLID weekly (end of day Friday) close above the weekly trendline and even then, I might personally give my position at little more room from there. My plan is to short an initial position here, bringing the short to a full position once/if the support level on this daily chart is clearly broken (a solid daily close or sharp move below). Remember, trades based off the weekly charts can take quite a bit of time to play out so consider passing on this one if you are a very active or impatient trader.


