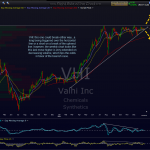
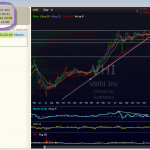
well, not so much a follow-up, as a late heads-up on VHI. as is often the case, i found so many set-ups on friday when i combed thru the charts that i didn’t get the time to make annotated charts on each one and post them all. fwiw, this one could still have a lot more meat left on the bone but personally, i passed when the alert went off yesterday. i am still waiting to see if the market can make a SUSTAINED and convincing move above those key resistance levels that i have been highlighting recently. with VHI being a thinly traded stock, i’m a passing on shorting it for now since thinly traded issues can be much more difficult to exit, especially during reversals when everyone else is trying to exit at the same time as well. regardless, i will categorize this as both an active trade and a set-up, since technically, it has triggered a short entry and some may decide to take it now.
this actually brings up a point: something that i was planning on doing for anyone who is interested is to create an e-mail list that will forward ALL my trendline and price alerts that i have running. that would give you a heads up when i am unable to immediately post a set-up that has triggered. when you receive an alert, you can just go to this site and enter the symbol in the search bar in the upper-right corner and that will show you all posts and charts made on that symbol. or, in the case of a stock like VHI that i have not yet posted, you can pull the chart yourself and will likely be able to recognize the pattern and decide if you want to take the trade.
if you are interested, just send me an e-mail stating such to alerts@rightsideofthechart.com, and i will add you to that list. you can also e-mail me anytime that you want to remove your e-mail address and of course, i don’t use or sell e-mail addresses or any other information.
here’s the chart of daily chart of VHI with notes as well as the alert generated thru my chart program, TC2000. the e-mail alerts will only state that an alert (trendline or price) was triggered, it will not show a picture of the chart like this…unless i can figure out how to do so down sometime soon…..
edit: well, as soon as i posted the chart, i can see that i actually DID make an annotated chart of VHI to post on friday (the one with the arrows showing a break in either direction of the pattern. the chart with targets is today’s updated chart). i thought i posted it before, maybe the upload failed? either way, i have added both charts now.


