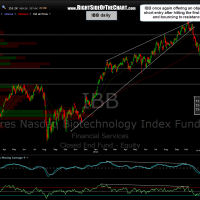
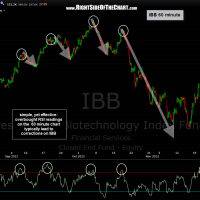
An added kicker for those taking advantage of this bounce back to resistance on the IBB short trade would be the fact that all recent overbought readings on the 60 minute time frame have lead to pullbacks in the ETF. Keep in mind that patterns never repeat themselves indefinitely or without fail but taken together with the technical posture of the daily chart, this only adds to the probability of a short trade initiated around current levels playing out successfully. Targets remain as marked on the daily chart. Consider a stop commensurate with your preferred target (mine is at least T2 at this time) with no less than a 3:1 R/R ($1 of loss allowance for every $3 of profit potential). 60 minute chart below along with the updated daily chart:
Results for {phrase} ({results_count} of {results_count_total})
Displaying {results_count} results of {results_count_total}


