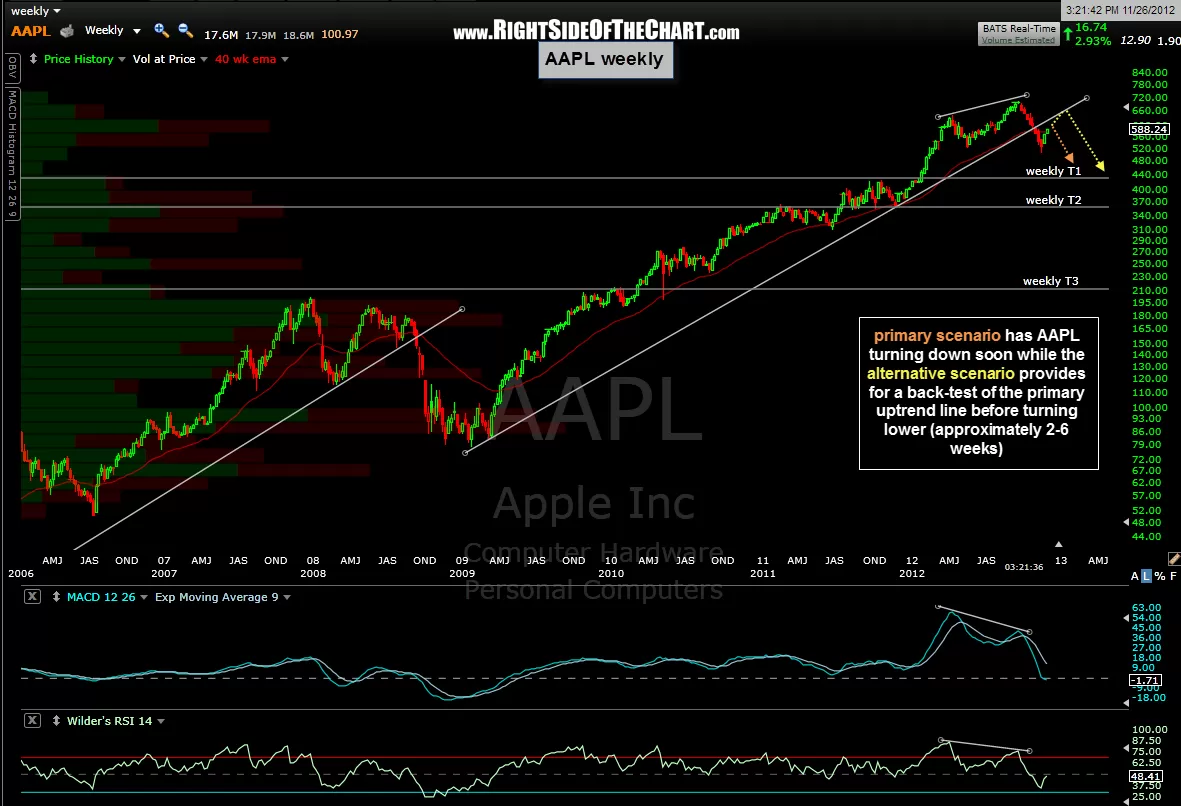
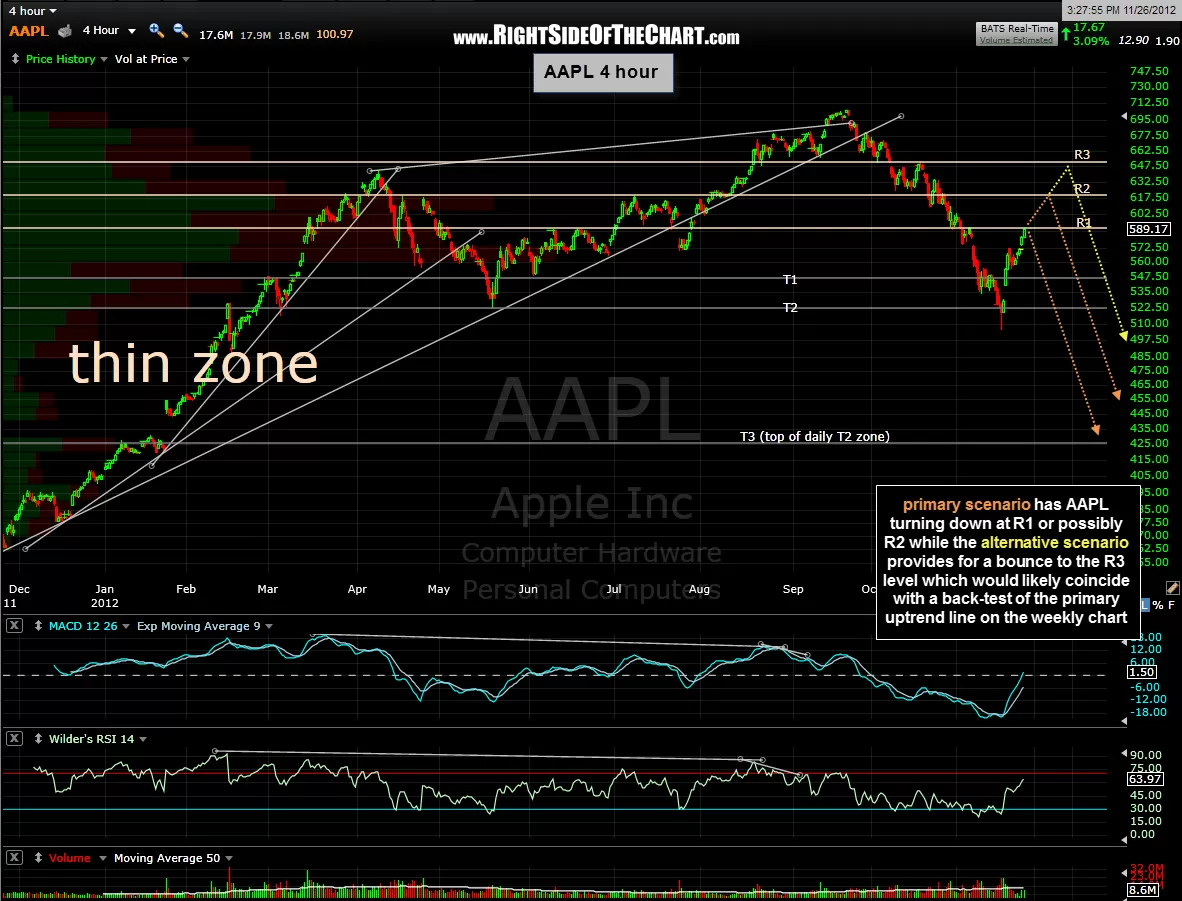
Here are the updated 4-hour and weekly time frame charts on AAPL with my primary and alternative scenarios for the stock. Among other things, one of the reasons that my primary scenario has AAPL turning down before it advances high enough to make a back-test of the primary uptrend line on the weekly chart (which is my alternative scenario) is that AAPL is currently back-testing the 40 week ema (which is also the 200 day ema). As I’ve pointed out in the past, the 40 week ema has acted as excellent support for nearly the entire bull market in AAPL since early 2009. I am going to hold off on adding AAPL back as an official short trade for now as I still prefer to watch both AAPL and the market over the next few trading sessions. Of course more aggressive or nimble traders might find these levels useful for quick trades or possibly to begin scaling back into a swing short position. Keep in mind that T3 on this 4 hour chart is the next target if & when I officially add AAPL back as a short trade soon. The T1 & T2 targets shown on this 4 hour chart were from the original short entry near the highs back in Sept, were already hit and no longer apply.

Results for {phrase} ({results_count} of {results_count_total})
Displaying {results_count} results of {results_count_total}