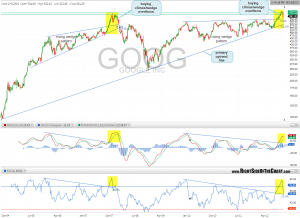
 while waiting for the trading halt on GOOG to be lifted, i decided to study the weekly chart a bit more and here’s what stood out to me:
just as it did leading up to the previous top in 2007, GOOG has recently set up in a text-book rising wedge pattern, complete with very solid negative divergences in place on the oscillators below. from my experience, these patterns, when confirmed by unmistakable divergences in place, have a very high probability of playing out. however, there are times, typically during periods of extreme bullish sentiment, where prices actually break to the upside of the pattern about exactly when they have reached the typical breakdown point (roughly ~70% to apex).
why that happens, i’m not exactly sure but my guess is that a lot of it has to do with a large number of traders shorting the stock early on anticipation of what looks like a high-probability breakdown of the pattern. however, due to the extreme bullishness and strong upside momentum in the markets at this point (usually just before a top on the stock or the broad market), the stock is hit with a buying climax, which is not uncommon at market tops. the buying climax overwhelms the shorts, thereby triggering a short-squeeze causing prices to rise even more sharply, a domino effect if you will.
whether or not my theory holds water can be debated but as i’ve stated here before, wedge overthrow patterns, on both bullish rising as well as bearish falling wedges, have been some of my most lucrative and high probability trades over the years. as highlighted in this chart, that is certainly what happened with GOOG leading up to it’s 2007 peak, just before that nearly 70% plunge in the stock. only time will tell whether or not we are in the early stages of a similar pattern but so far, it sure appears that way. the first step will be to see GOOG make a solid weekly close back within this rising wedge pattern. keep in mind that this would also confirm a very powerful bull trap as it would mean that GOOG has closed back below the recent breakout to new all-time highs. the next, and final, confirmed sell signal would come on a downside break below the current rising wedge pattern, the bottom of which, is also the primary uptrend line from the GOOG’s IPO date back in august 2004, another very bearish level if broken.

