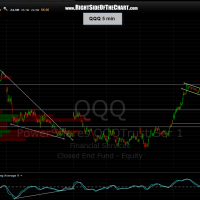
these are both the same updated 5 minute QQQ charts, one with a bunch of annotations and two opposing scenarios, the other a “clean” version in which to show how prices stopped cold at resistance earlier today, pulled back and have since formed a text-book bull-flag pattern. the big question is will that pattern play out to it’s expected measurement (60.30ish area) or will prove to be a bull-trap, breaking to the upside to draw in more longs & stop out more shorts before reversing? obviously, we won’t know the answer until tomorrow but something to keep on eye on.
Results for {phrase} ({results_count} of {results_count_total})
Displaying {results_count} results of {results_count_total}


