Of the 3 key economic releases out today:
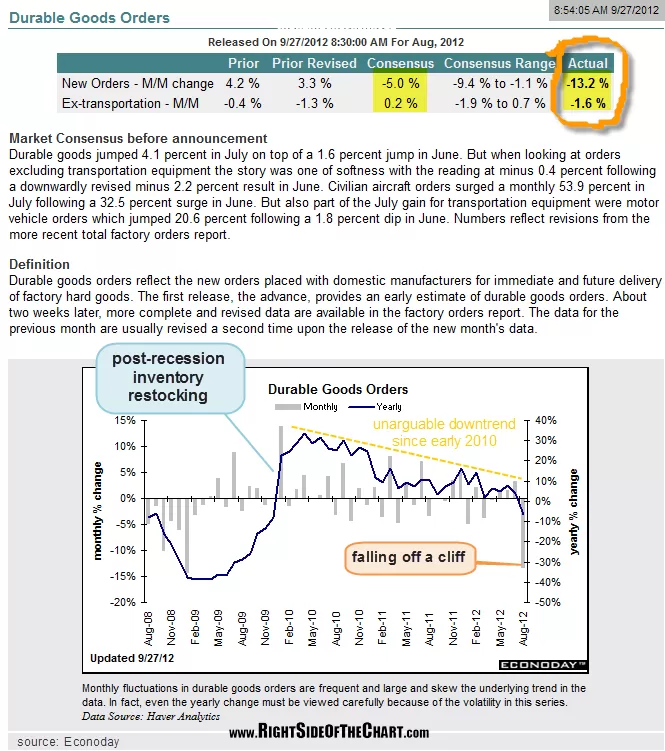
- Durable Goods completely fell off a cliff, coming in well below even the most pessimistic of estimates.
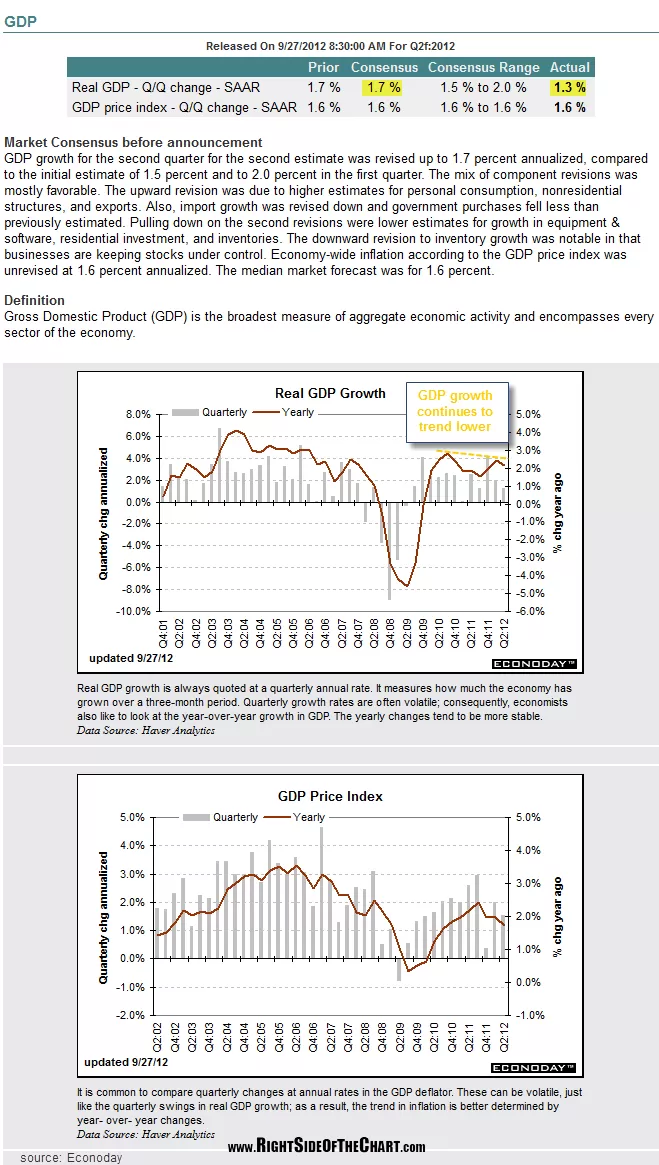
- GDP also came in well below expectations and also below the low-end of the consensus range.
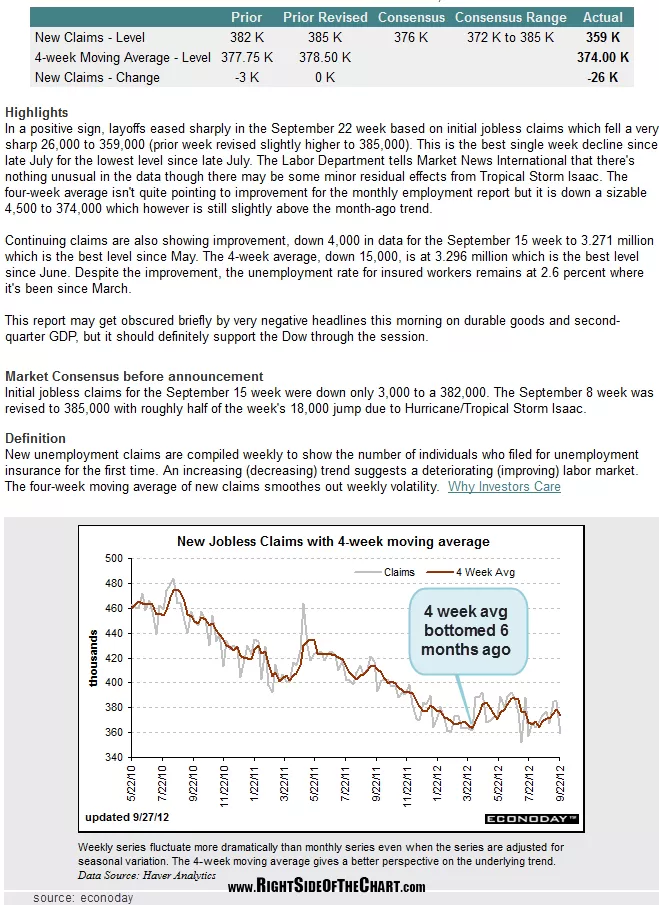
- Weekly Jobless claims came in better than expected and below the bottom of it’s range (a positive).
Of the three, obviously the first two shadow the jobless claims numbers in significance. First off, these are only weekly jobless claims figures while the first two reports are only released once a month. Weekly data is more subject to temporary counter-trend blips. In addition, the the jobless claims clear downtrend (bullish) ended about six months ago and has remained higher since. Most importantly, as the unemployment malaise continues to drag on and unemployment remains very elevated, naturally you will see fewer and fewer jobless claims (since there is a smaller pool of “workers” to lose their jobs). Again, the first two reports speak volumes to me so now we’ll watch to see how the market follows through this week and into early next week.
As these figures only strengthen the case that the downturn in the US economy is building momentum, the longer the equity markets ignore the disconnect between fundamentals and stock prices, the worse the reversion to the mean will be. I don’t make many promises or guarantees on this site but I do promise that it really isn’t different this time around meaning that fundamentals still do, and always will drive stocks prices in the long-run. However, as has been the case throughout the history of the financial markets, there are and will always be short-term disconnects. Usually, those disconnects between stock prices and fundamentals are caused by excessive fear (stocks undervalued) or exuberance (stocks overvalued) of market participants and at times, those disconnects can be caused, or enhanced I should say, by direct and indirect government intervention in the financial markets. The further these disconnects bring stock prices away from their average true value (the “mean”), the more severe the reversion will be when it sets in.
Bottom Line: The fundamental case for at least a correction and very likely the end to the bull market that began in march 2009 continues to build. However, disconnects between fundamentals and stock prices can continue for extended periods of time. It is the technical evidence (charts) that will give traders and astute investors and edge on timing the entry and exits of their positions. As I have shown for months now, the bearish case also continues to build from a longer-term technical perspective as well. Recently, we’ve had several bearish technical events on the daily time frames (failed wedge overthrows, breakouts to new highs which have failed, etc..). The next clear sell signal will be for those few remaining indices that are still holding above their recent new highs breakout levels to fall back below those levels, thereby increasing the odds that the recent breakouts were bull-traps, events that are almost always followed up with very impulsive selling.