I continue to keep things very light as this market is about as unconducive to trading as it gets. The technical picture remains unclear and the R/R for being positioned aggressive short or long at this time is just not worth it IMO. With that being said, I’ve received a couple of inquires on the VHI trade as well as gold & the mining stocks lately (which I will try to comment on later). Although my position in VHI is very small, I am still keeping an eye on this one and still hold my small, initial position in the stock.
In the last update, I stated that if VHI made a solid break below last Wednesday’s lows, then I would dump it. Yesterday the stock did trade below the bottom of last week’s lows but by a relatively small margin. VHI traded as low as about 4% below last week’s low and closed around 3% below those levels. Relatively speaking (relative to the upside gain potential and daily price swings in this stock), 3-4% is a typical daily swing for VHI. I decided to hold my fractional position for now but as stated in the original post, I will not add to the small starter position until/unless prices break above the 120-minute (2-hour) falling wedge pattern. Besides completely abandoning the use of stops, I can think of no better way to rack up huge losses on a trade than to average down (past the point of a reasonable position size and/or your pre-determined final buy level) on an high-beta stock in virtual free fall such as VHI. I’ve already highlighted the potential risks on this trade nearly to the point of ad nauseam but I just wanted to reiterate this one last time as to avoid any confusion. I’d also like to share that the reason for so many updates on such a small, speculative position is largely due to the fact that there just aren’t many technical developments in the markets or with any active trades to discuss recently.
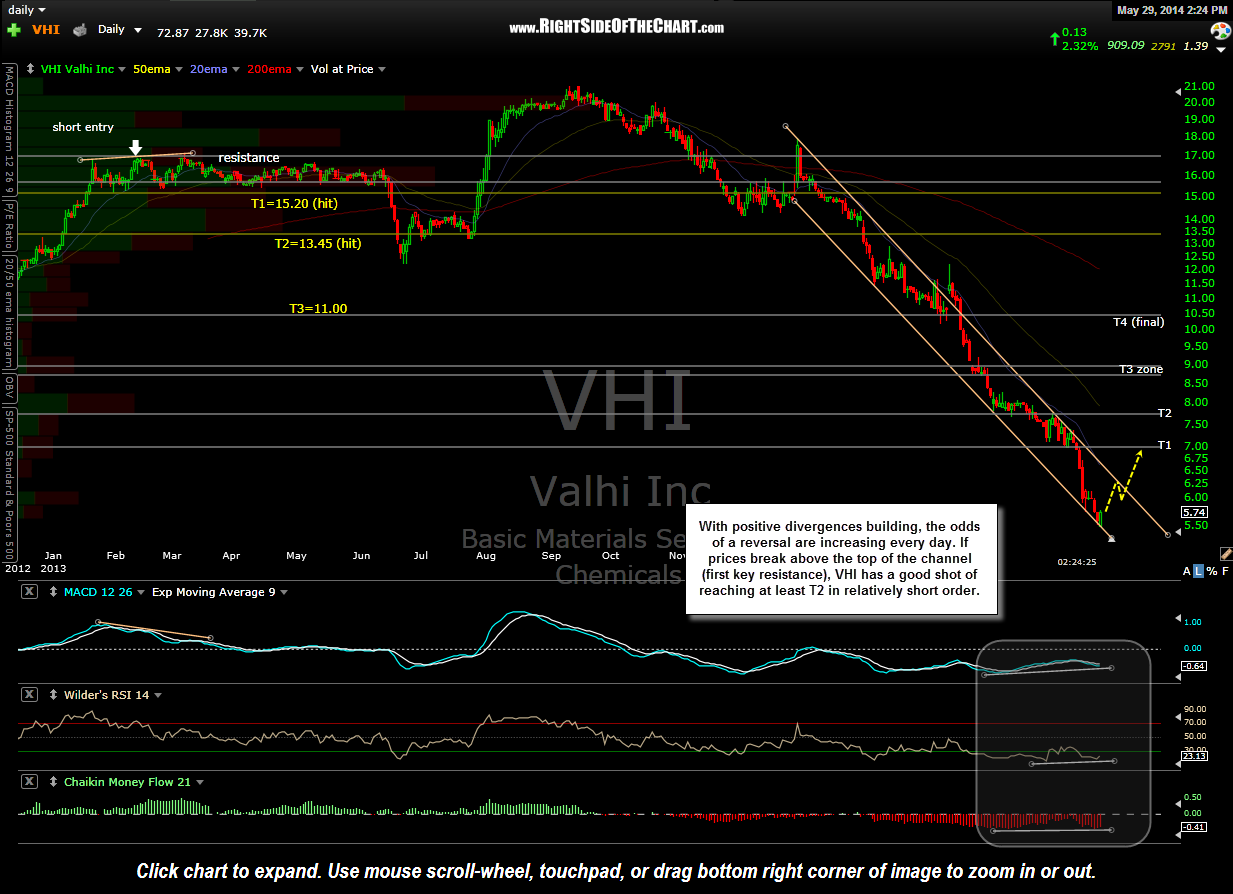
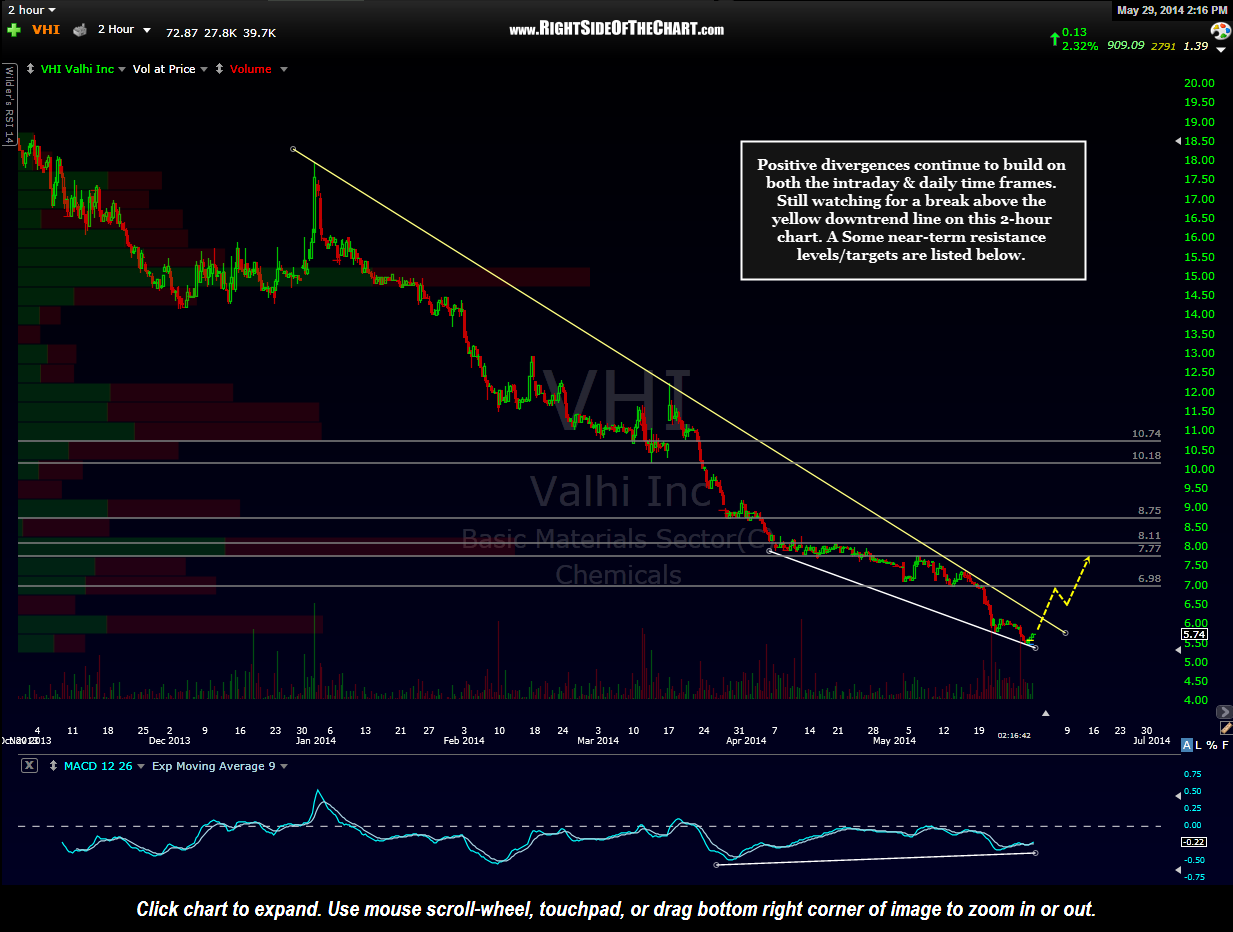
With that being said, VHI continues to ride the bottom of the steep descending channel (daily chart) while positive divergence continue to build under the bullish falling wedge pattern on the 120-minute time frame. I’ve removed the alternative downtrend line shown on the previous 120-minute chart and remained focused on a break above this primary (yellow) downtrend line. I’ve also added a handful of near-term resistance levels which could be used as price targets, should VHI break above the pattern (120 minute chart) in addition to some longer-term swing trade targets on the daily chart (T1-T4), which would come into play should prices break above the descending channel. Every trader has a different trading style, preferred time frame and stop parameters. Suggested stops, especially those on a scale-in trade with multiple price targets will depend on one’s average cost and preferred target(s). As always, feel free to contact me if you have any questions on this or any other trade idea on RSOTC.
-

- VHI 2 hour May 29th
-
- VHI daily May 29th