
TASR (Taser International Inc.) will be added as both an Active Short Trade here around 18.27 as well as a Short Setup with an entry (or add-on) to be triggered on a break below this ascending channel. Normally I would wait for a breakdown below this ascending price channel before establishing a short position but with TASR recently failing to take out the previous highs put in place back in late 2007 (bearish) and also recently rolling off extreme overbought levels on the weekly chart (see below), my plan is to establish a partial short position here while adding to my position on a break below the pattern. One other consideration in my analysis (not shown on the weekly chart below) is the recent volume surge on TASR, which is indicative of a buying climax. Similar volume surges also preceded the Dec 2004 top, the July 2007 top & the Feb 2010 top.
While my final & preferred target, T3 at 9.90, which is about 46% below current prices may seem very aggressive, such a correction is well within the average range of the previous 5 corrections in TASR that followed similar overbought readings on the weekly chart over the past decade. At this time, my preferred stop would be on any solid weekly close above the recent high of 20.83. Daily & weekly charts below.
Click here to view the live chart of TASR
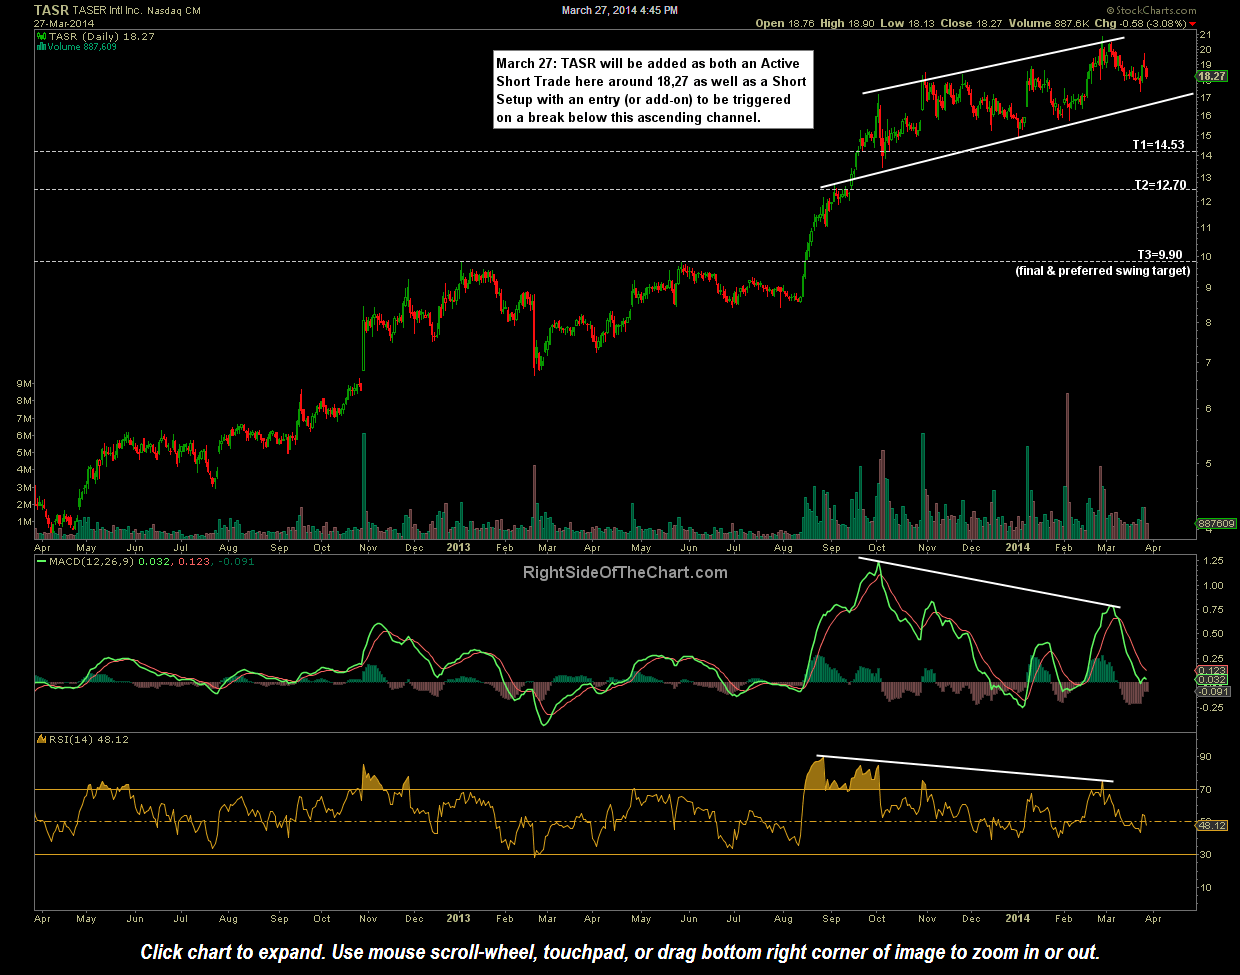
TASR daily March 27th

TASR weekly March 27th