
Note: This will be the first of several trade updates today & into tomorrow afternoon before I leave town. As there are quite a few trade ideas in need of updating, after this post, email notifications will only be sent out on time sensitive updates, such as a trade idea currently approaching a price target, suggested stop or offering an objective add-on or new entry on a test or breakout of support or resistance. Email notifications on the non-time sensitive trade updates will be suppressed in order to reduce inbox clutter. An email notification will be sent out once all trade ideas have been updated.
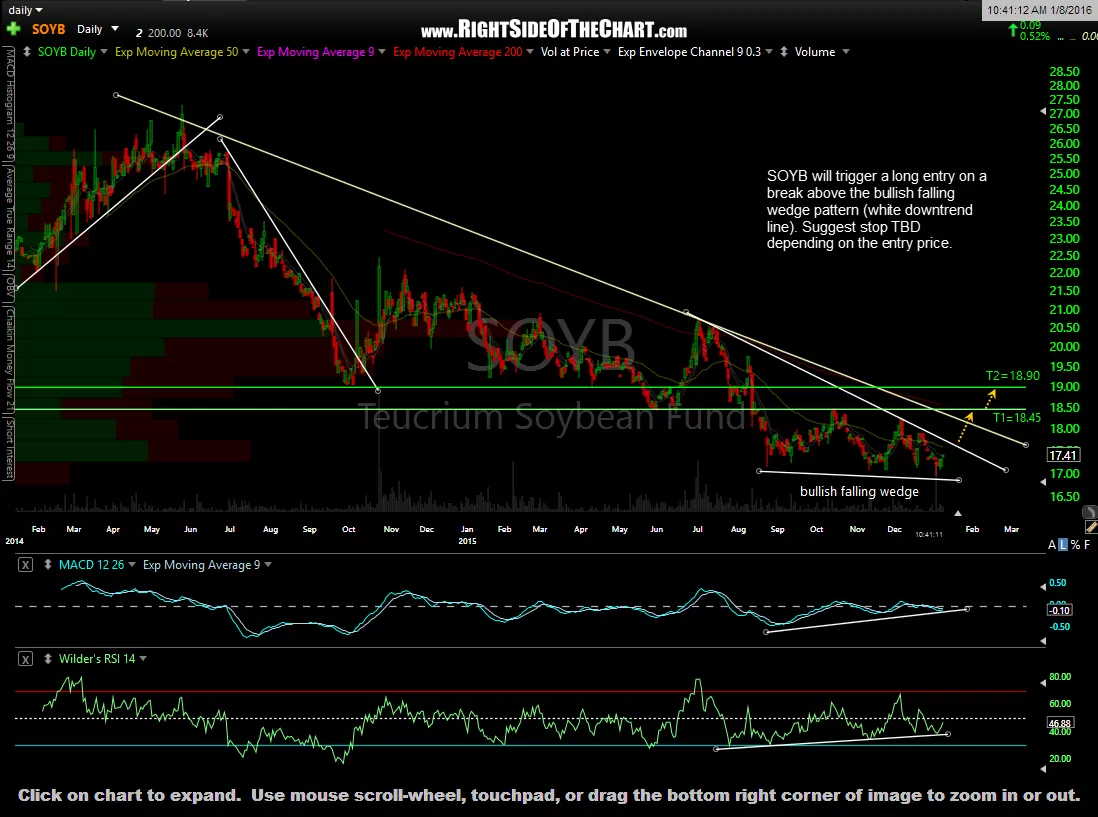
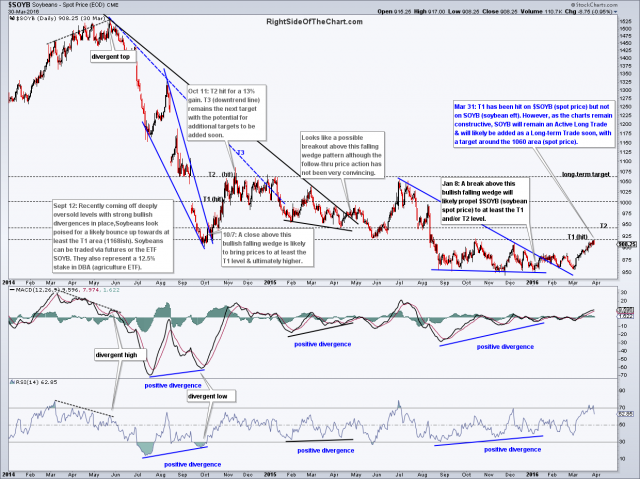
SOYB (Soybean ETF) was added as a Long Trade Setup in this post back on Jan 8th with a long entry to be triggered on a break above the bullish falling wedge pattern defined by the white downtrend line (lower of the two). SOYB could pull back soon as $SOYB (spot prices) are at resistance. However, the longer-term charts, both daily & weekly, for soybeans remains quite constructive so this trade will remain active for now with additional price targets likely to be added, should the charts continue to firm up. The original daily chart from that post along with the updated daily charts of SOYB are shown below:
-

- SOYB daily Jan 8th
-
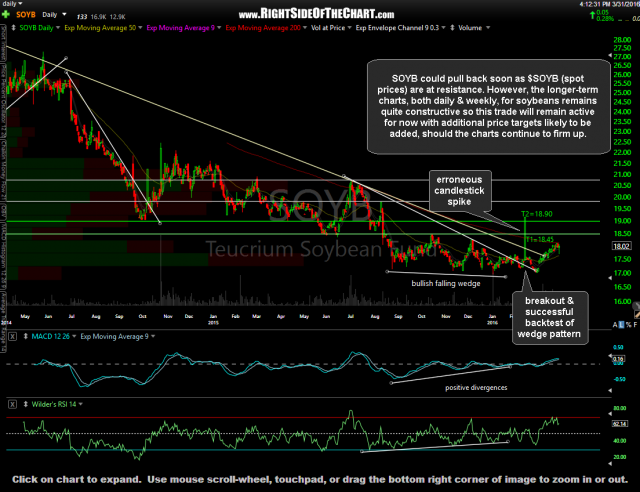
- SOYB daily March 31st

-
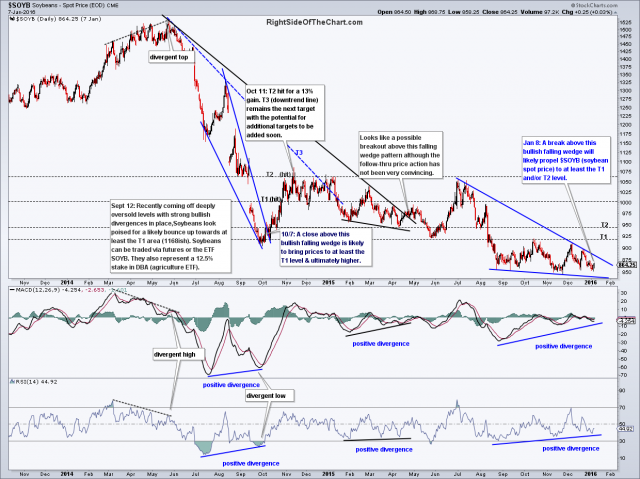
- $SOYB daily Jan 8th
-
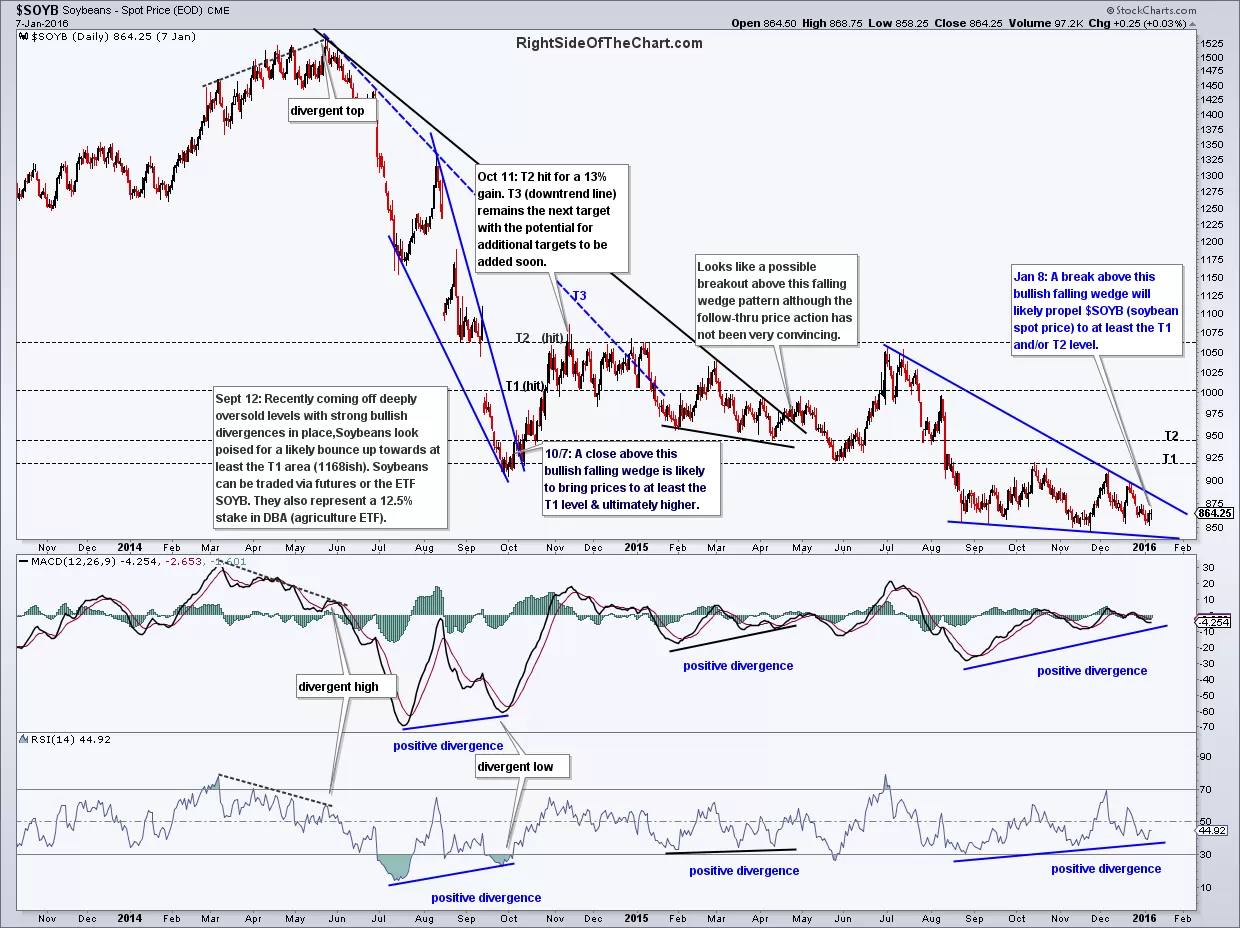
- $SOYB daily March 31st
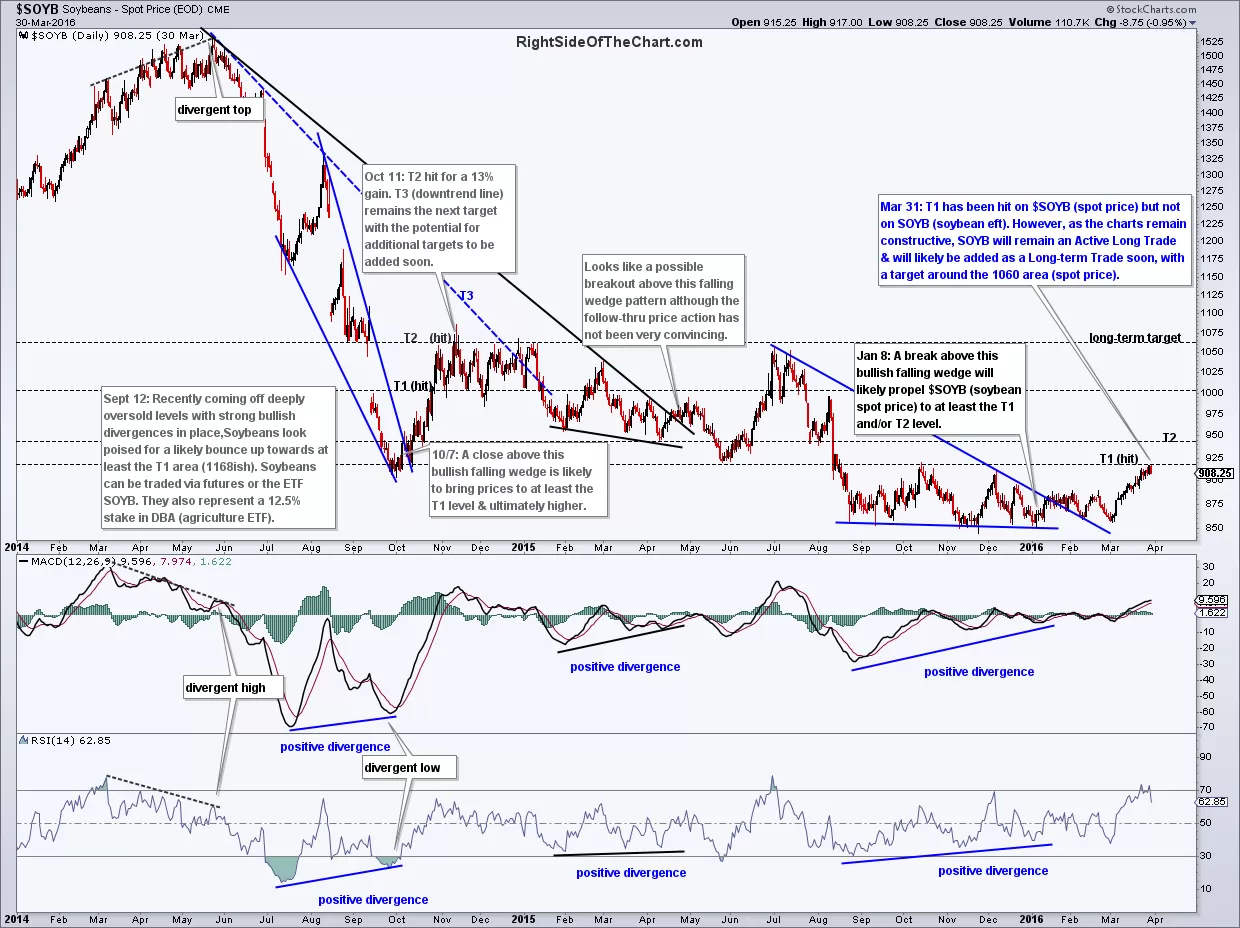
With that being said, the charts above include the first daily chart of $SOYB (Soybean spot price) and the updated daily chart. As you can see, $SOYB has now hit my first target which was based off the comparable price reactions as the SOYB daily chart. Being that the total gain from entry on SOYB is quite modest at this point and more importantly, the charts remain constructive, while I might normally revise the first target to current levels based on the fact that $SOYB has hit my first target, I will leave the official T1 (18.45 on SOYB) in place for now. In fact, I may quite likely add SOYB as a Long-Term Trade/Investment idea with additional price targets. However, with $SOYB currently at resistance, it would only be prudent to either wait for a pullback OR for $SOYB to clearly take out that T1 resistance level.
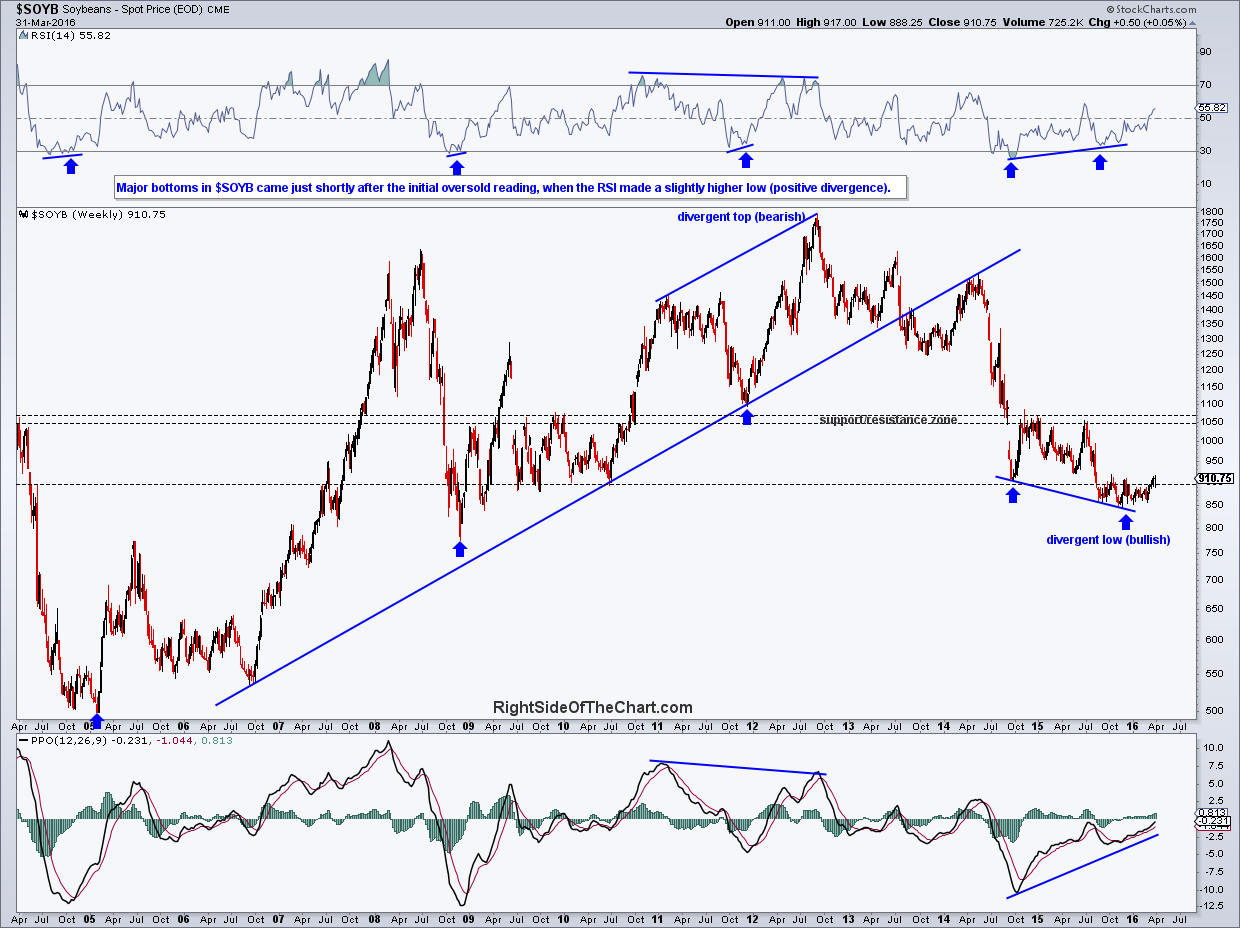
$SOYB weekly March 31st
From a longer-term perspective, this 12-year weekly chart of $SOYB looks very constructive, indicating a very decent likelihood that the 3½ year bear market in soybeans is most over or not far from a bottom. While many people have unwavering faith in the Fed to continue to lift the stock market at will for as long as they see fit, I have a different sort of blind faith in the Fed, one based on their historical track record and that is: 1) To be reactive, never proactive and 2) In doing so, to continue their current course of monetary policy, whether easing or tightening, until the unintended consequences of their excessive attempts to control the natural course of the business cycle (and more so in recent years, the stock market) have clearly & suddenly begun to manifest in such a powerful way that they will invariably, once again, be behind the curve and powerless to stop it (in this case, I am referring to a re-inflation trade in various commodities such as the beaten down agricultural commodities, crude oil, precious & quite possibly industrial metals).
While I don’t expect an explosion in the oilseed & grain commodities anytime soon (nor do I rule it out), I do believe that various agricultural commodities offer a much better R/R profile at this time than do US or global equities. Translation: The odds of a 20%+ drop in grains is considerable lower than the odds of a 20%+ drop in equities while the potential for 20%+ increase in various ag commodities such as soybeans is considerably higher than a 20% gain in equities from current levels.