
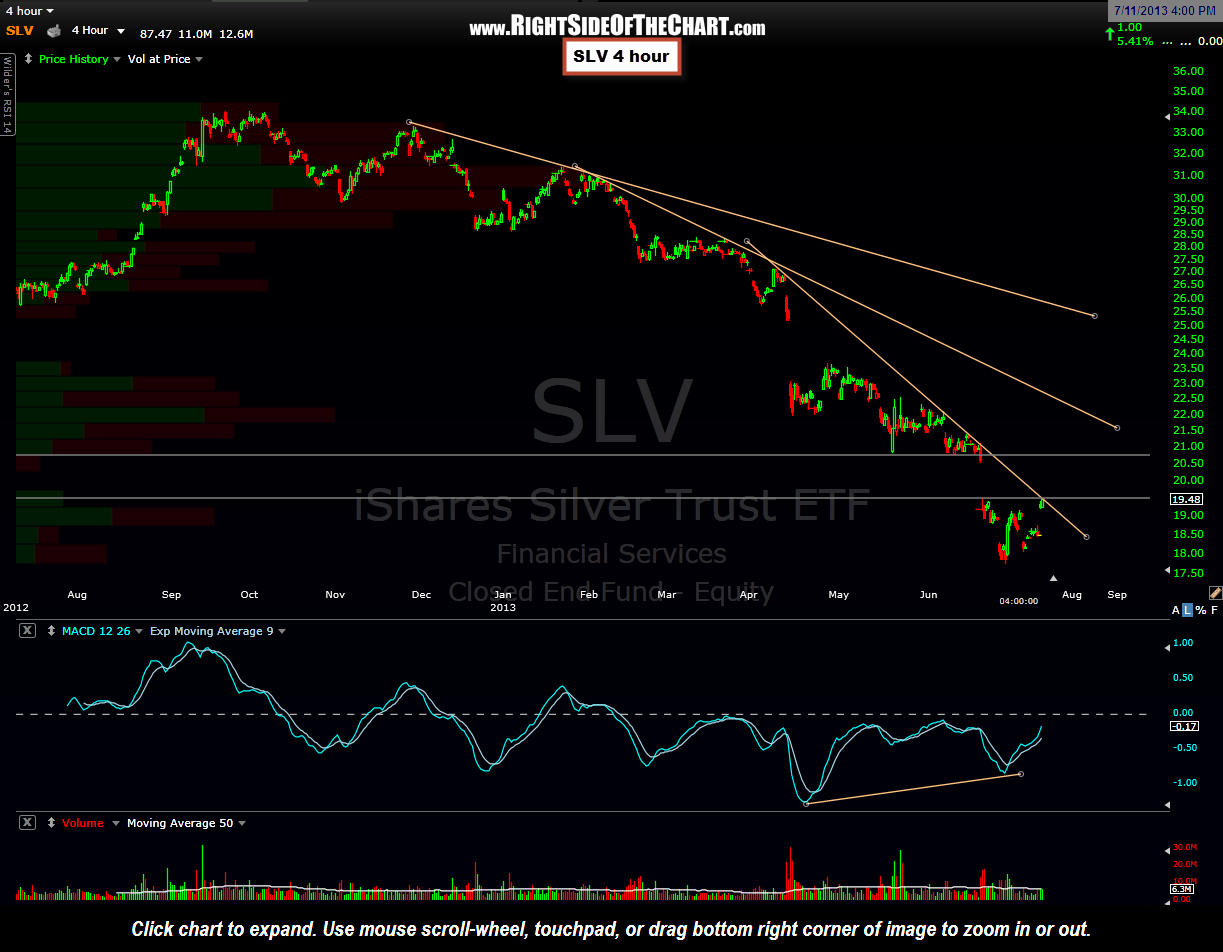
 Here’s an updated 4-hour chart listing some potential near-term targets/resistance levels for those in the trade. Notice how as the sell-off in SLV progressed, the etf began descending at an accelerating rate, hence the series of progressively steep downtrend lines. This type of price action is comparable to a parabolic run in a stock during a buying climax, only in reverse.
Those trendlines are now likely to act as resistance on the way up now, assuming the worst of the selling is over for now. I’ve also added to horizontal resistance levels and interesting enough, the first comes in right where the lowest trendline came into and as such, SLV found resistance at that level all day after a strong gap up this morning. Therefore, any solid break above today’s highs are likely to quickly propel SLV towards the next horizontal resistance line which comes in around 20.75 (my preference) or possible the top of the gap defined by the 6/19 lows of 20.53. As such, SLV will offer the next objective long entry on a break above today’s HOD of 19.50.