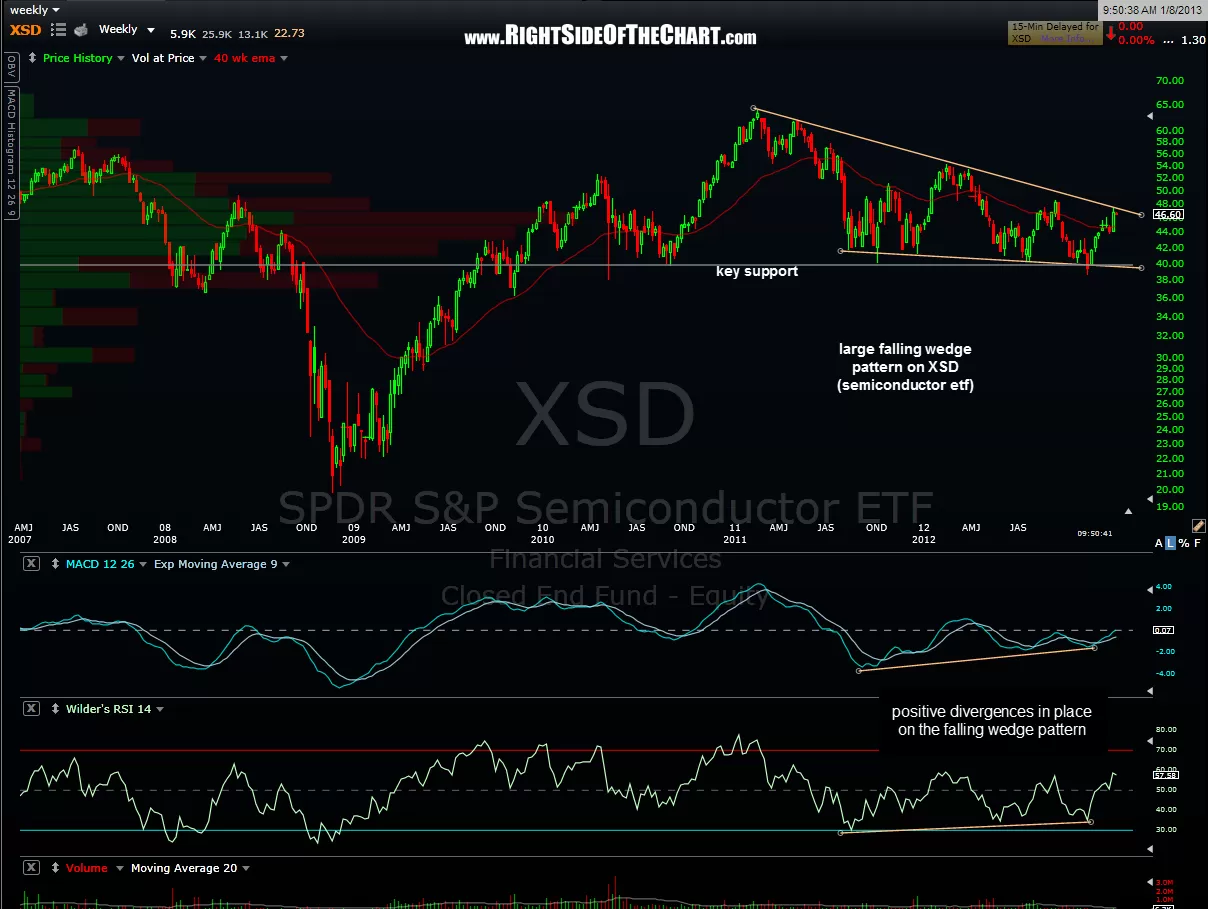
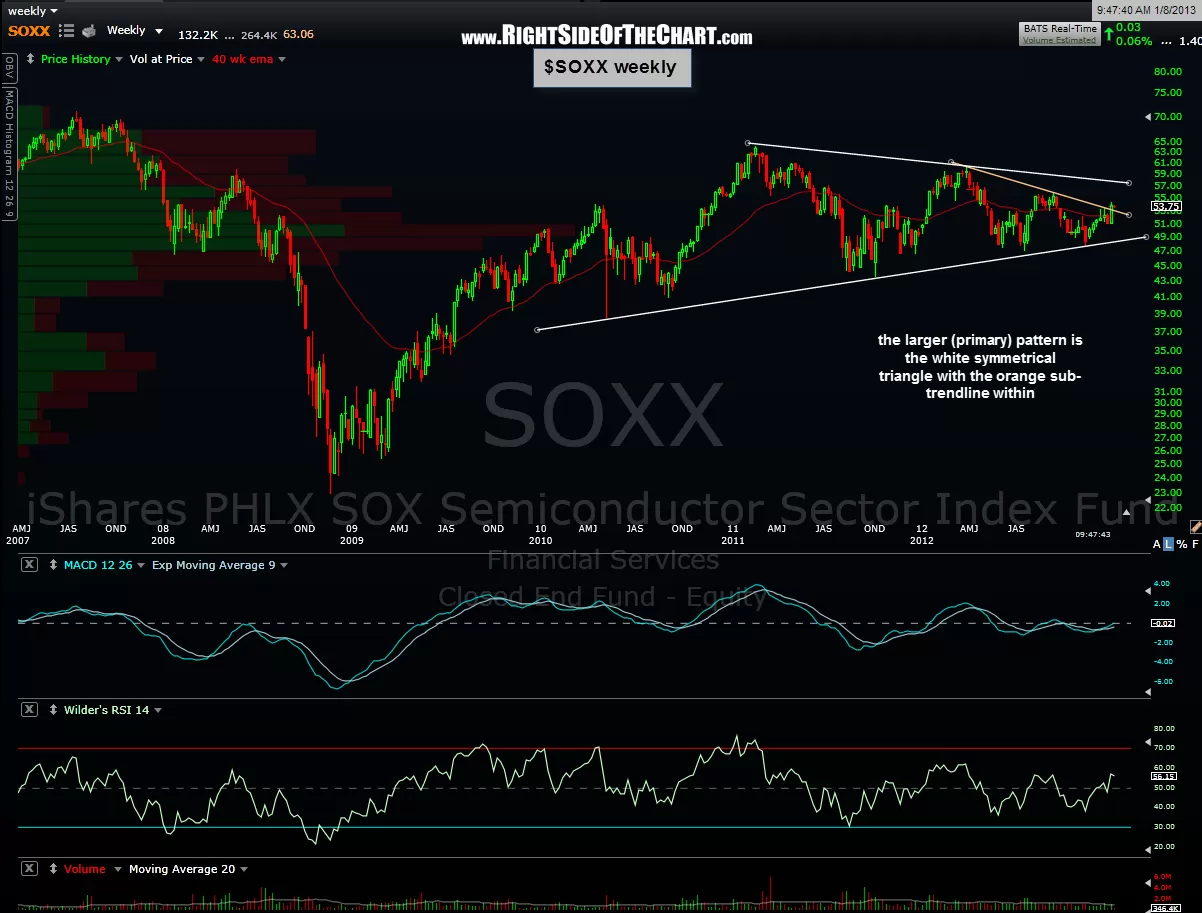
Below are the weekly charts of two semiconductor sector tracking etf’s, SOXX and XSD. As you can see, SOXX (which tracks the $SOX- the PHLX Semiconductor Sector Index) looks to have just cleared a sub-uptrend line within a larger symmetrical triangle pattern. The XSD (SPDR S&P Semiconductor ETF) is testing the top of a fairly distinct bullish falling wedge pattern, complete with positive divergences in place on the MACD & RSI.
Combing thru all the of components of each of those sectors, I found several potential long setups, some which have already recently broken above resistance. I’ll post the charts on the individual names soon but I am only adding them as trade setups at this time (vs. active trades) as my belief is that the market is too overbought in the near-term and any breakouts around current levels are likely to fail soon. My best guess is that if these patterns are to play out to the upside, prices will most likely pullback or consolidate first. Another possibility (among many) would be a breakout here soon with a backtest of the pattern or a consolidation above shortly afterwards. Therefore, if you are currently bullish and like these charts, maybe consider a scaling into the position(s) vs. taking a full position at once. Of course my take on the market can & will be wrong at times so as always, trade (or pass) on these setups as you see fit. Of the two semi etf’s below, my preference for trading would be XSD. Therefore, XSD will be added here as a trade setup with targets & stops TBD once/if a long entry (solid breakout on volume or a close above the pattern) is triggered. SOXX & XSD weekly charts: