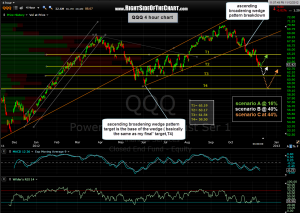
 Ok, this is the analytical side in me coming out but to keep this post short & simple, I have assigned probabilities to the three most likely scenarios I see playing out from here. Of course, there are virtually an infinite number of possible scenarios that one could assign to the market at any point in time but for the sake of simplicity, here are the three that I see as most likely.
For weeks now, I have been focusing the bulk of my analysis on the 4-hour period QQQ chart as I felt that the QQQ having lead the market on the way up, would most likely lead the market on the way down, at the very least in the initial stages of the new downtrend. With the QQQ/$NDX now down over 10% from it’s recent peak with the $SPX/SPY only down about 6 1/2%, that has clearly been the case.
This updated 4-hour period QQQ chart shows my slightly revised scenario. Since shortly before the market topped, I have been calling for essentially exactly was has happened so far: starting with the rising wedge overthrows and bull-trap/false new high breakouts on the daily index charts; the break back down into & then below those wedges with the selling becoming more impulsively once those patterns broke to the downside. I also highlighted this ascending broadening wedge pattern (orange trendlines) on this 4-hour time frame before and after it broke down. For weeks now, I have also stated that I expected the QQQ to only have a muted reaction (temporary pause/shallow bounce) off T2 once hit, which has been the case so far. The fact that everything has played out according to plan only increases the odds that it will continue to do so but of course, I would never blindly stick with an aging forecast without continually reaffirming it with supporting technical evidence.
That brings me to this post. Based on my analysis of not just this chart but countless other variables, I am now leaning towards a move down to T4 before any substantial bounce (i.e.- A bounce large enough in scope and duration to confidently reverse my overall positioning from short to long for swing trades, not just a quick counter-trend bounce like Friday). As the markets are dynamic, my analysis can change on a dime and I will do my best to communicate if & when that happens asap. Until then, I put the odds on the three most likely scenarios on this 4-hour QQQ chart (the scenarios are color coded, with “C” being my preferred scenario and my previous preferred scenario, “B”, not far behind. Feel free to contact me if you have any questions or feedback. Also, keep in mind that with volatility beginning to rise, this market can & likely will move sharply in any direction so please adjust your position sizing and use of leverage commensurate with your risk tolerance and experience, stay flexible and do not become complacent with your stops.

