
Of all sectors of the U.S. economic, the banks have been priority #1 for the Fed since the meltdown in the financial system and their policy of pulling out all stops in order to boost the sector has worked, with the XLF (Financial Sector ETF) up nearly 290% from it’s March 2009 lows. The XLF is comprised of various financial companies including banks, REITS, & insurance companies with a focus on the largest of financial companies, i.e.- the TBTF financial institutions (BAC, WFC, AIG, JPM, GS, etc…).
While I do see some bearish technical developments forming on the XLF, I think a compelling bearish case can be made on the KRE (Regional Banking ETF) at this time. On the daily chart below, we have what appears to be a text-book Head & Shoulders Topping pattern forming although there is still a bit of work to be done. If the regional banks did indeed print a major top with the March 21st highs and the sector is in the latter stages of a H&S pattern formation, ideally we need to see prices to start moving impulsively lower soon, preferable on above average volume (volume increases are a preferred criteria of a Head & Shoulders pattern when prices fall from the top of the head & the top of the right shoulder). Potential H&S patterns are a dime a dozen, especially in bull markets, with most failing to materialize. Therefore, we will just have to monitor this pattern, first awaiting confirmation that the right shoulder has been put in place and if so, a break below the neckline would be the official trigger for a short entry.
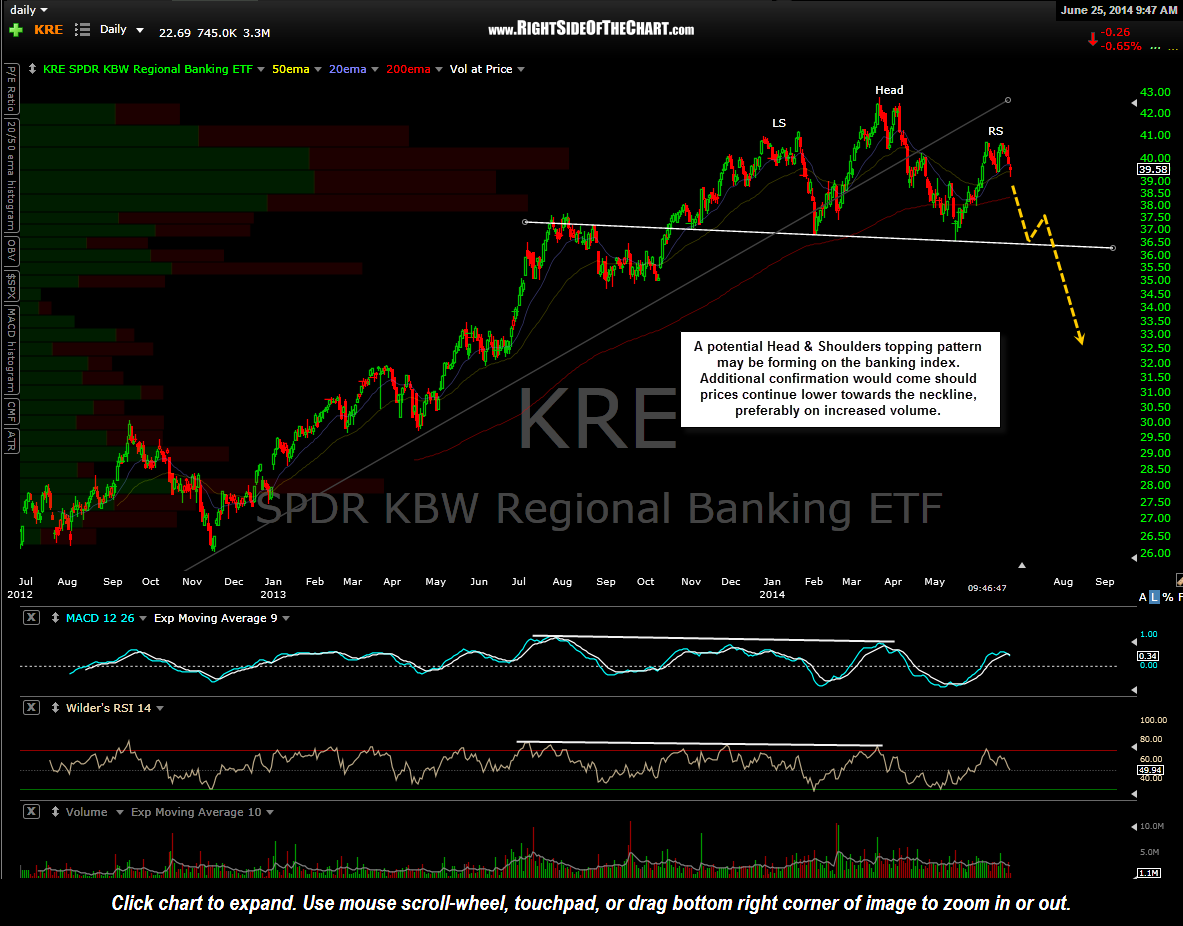
KRE daily June 25th
As mentioned above, head & shoulders patterns, being one of the most easily recognized chart patterns, have been somewhat common in recent years with only a small percentage actually playing out (i.e.- fully forming, breaking down & going on to hit their measured downside target). What helps put some wind into the sails on this pattern is the fact that the KRE has recently broken below it’s nearly 3 year primary uptrend line & even more recently, made a successful backtest of that trendline which just happened to coincide with the top of the right shoulder formation. Also note the recent volume surge into the March highs on KRE with the 30 period MA (white line) peaking at the same level as it did on the selling climax back in late 2011. That may indicate a possibly buying climax in KRE recently which, if so, has implications for a more lasting top in the regional banking sector.
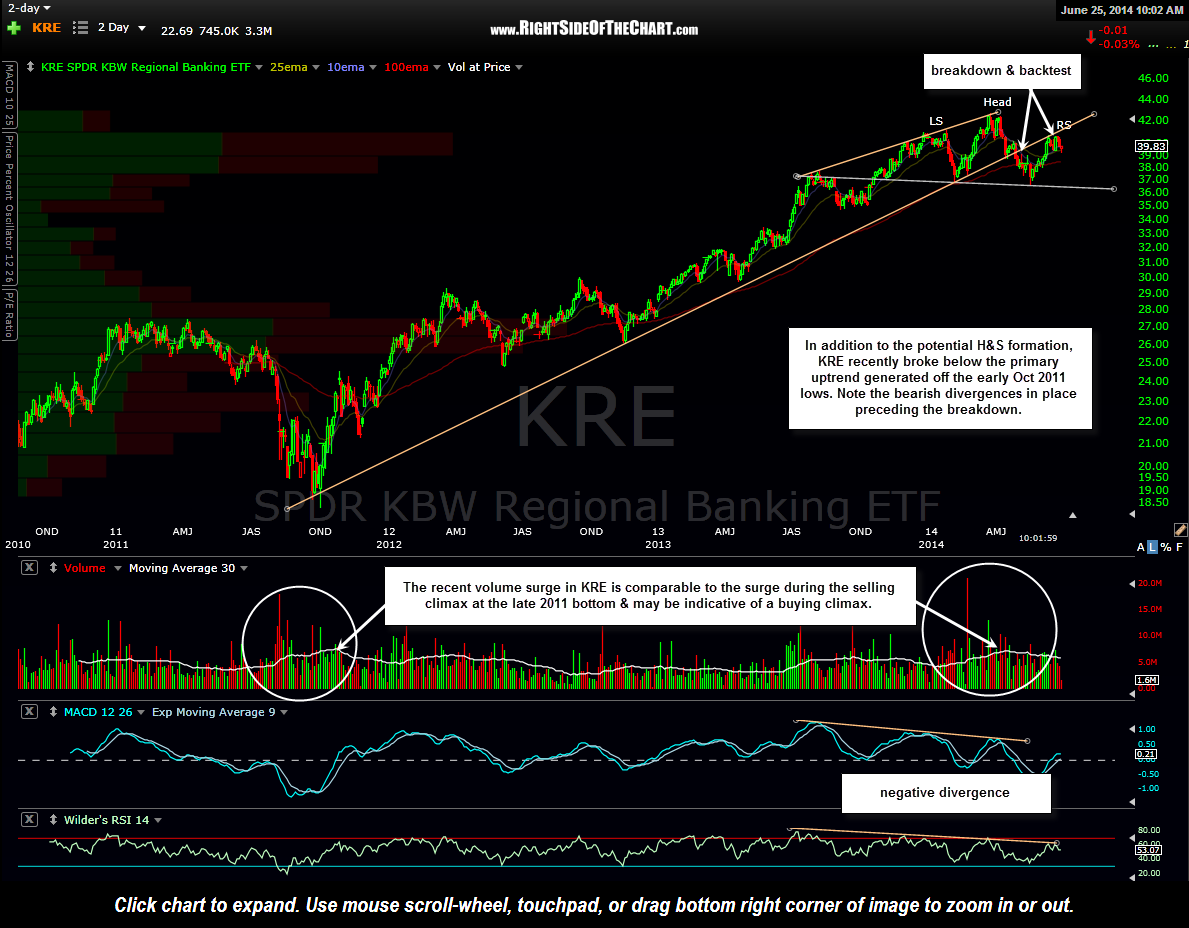
KRE 2-day June 25th
There are a couple of ways to play this. A conventional swing trader might continue to monitor this potential pattern formation, waiting to see confirmation that the right shoulder has been fully formed by prices moving impulsively lower down to the neckline. From there, with the pattern complete, a break below the neckline would be the trigger for a short entry. More aggressive traders might opt to establish a partial or full short position in KRE here with a stop not too far above the May 9th reaction high of 40.76. That level is the top of the potential right shoulder although with prices only just off that level now and symmetry on the pattern still allowing for a little more time & price increase (visually mirror the left & right shoulders), it may take a couple of weeks and possibly a marginal new high before the top of the right shoulder is in place. Only once (if) prices start to move sharply lower on increased volume will we be able to say with a good degree of confidence that the top of the right shoulder is in place.
I will add KRE as a Short Setup at this time with an entry TBD, most likely if/when I see some decent evidence that the top of a right shoulder is in place. I’m also waiting to see the QQQ break below the 60 minute bearish rising wedge pattern posted yesterday before adding any short exposure. The Q’s managed to bounce off that lower uptrend line to the penny just before the close yesterday and successfully tested that level once again immediately following the open today.