SLV will added as both an Active Long Trade as well as a Long-Term Trade Idea here around current levels (current price is 18.92). Ironically, it was exactly one year ago today, on June 25th, 2012, that I posted this first weekly chart of SLV (silver etf) below.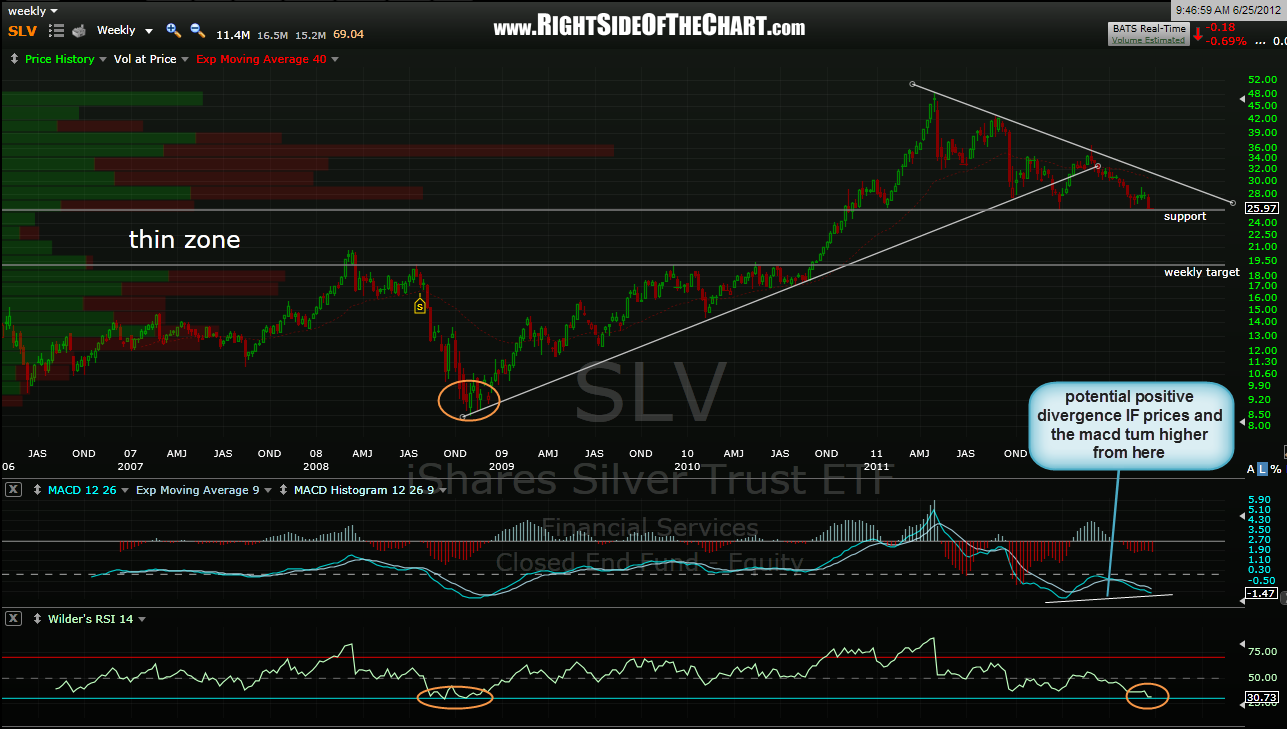 At the time, SLV had fallen to a key support level while at overbought levels that had only been observed once before, back in late 2008 just before SLV launch it’s strongest bull market since the ETF was created. From there, the positive divergence and overbought buy signal did indeed play out for a nice bounce in SLV. However, as was pointed out on the site just a over a month early, SLV had recently broken it’s primary bull market uptrend line and had therefore most likely begun a new, larger primary downtrend (hence the reason for the aggressive downside target). That bounce off support was stopped cold a few weeks later when it backtested that recently broken uptrend line and from there…well that brings us to today. As this updated weekly chart below shows, SLV has now hit my downside target and once again, has reached rarely seen oversold levels which has historically preceded significant upside in the ETF. Although I would prefer to see positive divergence on the weekly MACD or PPO, we do have divergences forming on both the MACD & RSI on the daily chart (not show here).
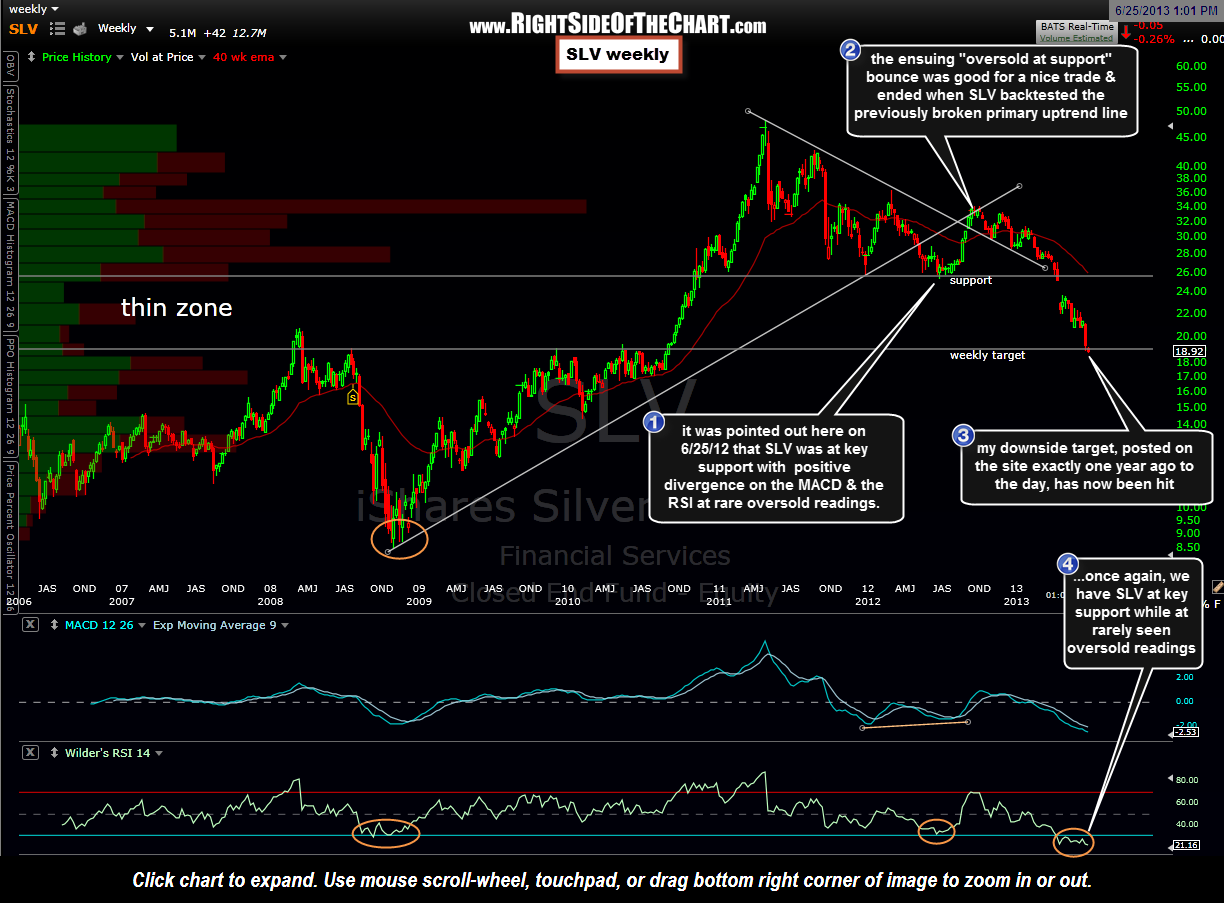 As the markets, especially precious & industrial metals are in full-blown distribution mode, my preferred strategy is to open a starter position here and continue to scale into SLV, along with some select mining stocks (to be discussed in a follow-up post soon) over the next few weeks. Targets and suggested stops on this trade to follow soon.
