
This long-term chart of PEIX (Pacific Ethanol Inc) speaks volumes to me: Double-bottom, divergent low, coming off oversold levels that have sparked “rallies” ranging from 130% to 1275%, bullish falling wedge, etc… just a beautiful chart IMO.
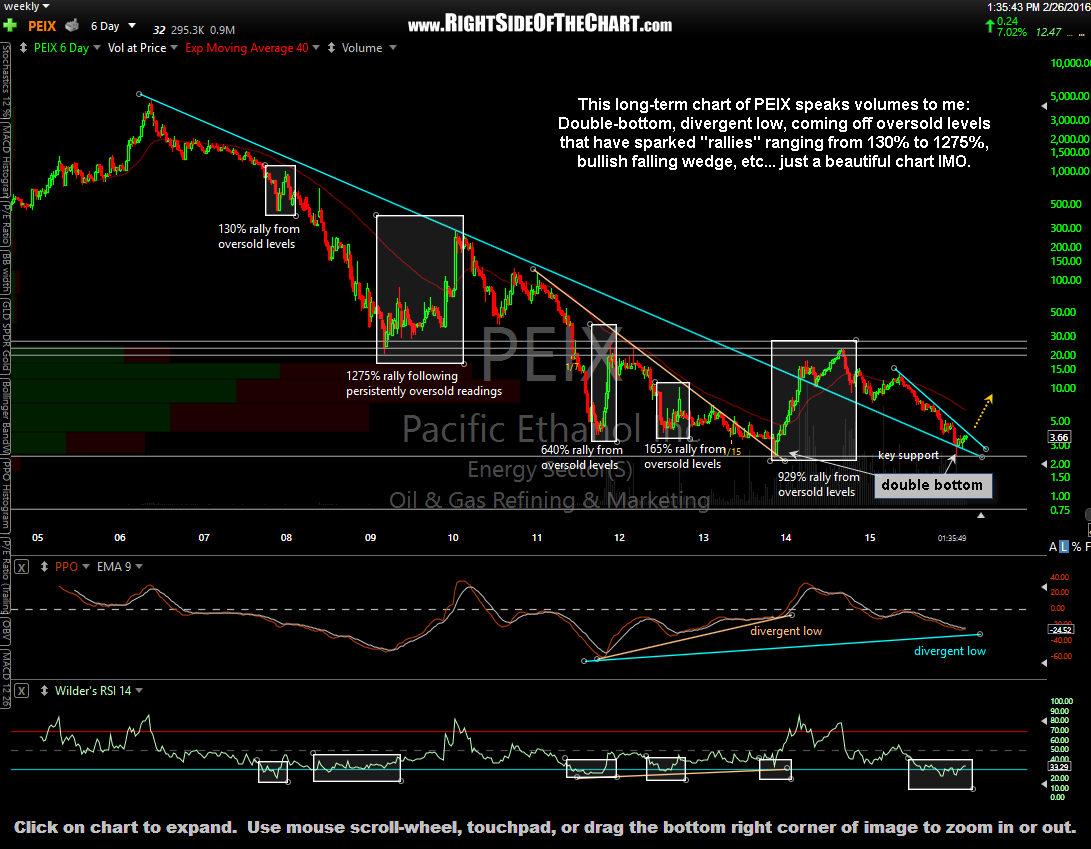
PEIX weekly Feb 26th
Although PEIX might begin to rally on a break above the 3.80 resistance level + the 50-ema (which has defined bullish & bearish trends), the official long entry will be on any break above 3.95, which should have cleared this downtrend line, assuming a breakout triggers soon. The entry price might be adjusted down to a break over 3.80, should PEIX fail to breakout within the next couple of weeks. The maximum suggested stop if targeting T2 would be based on a daily close below 3.00.
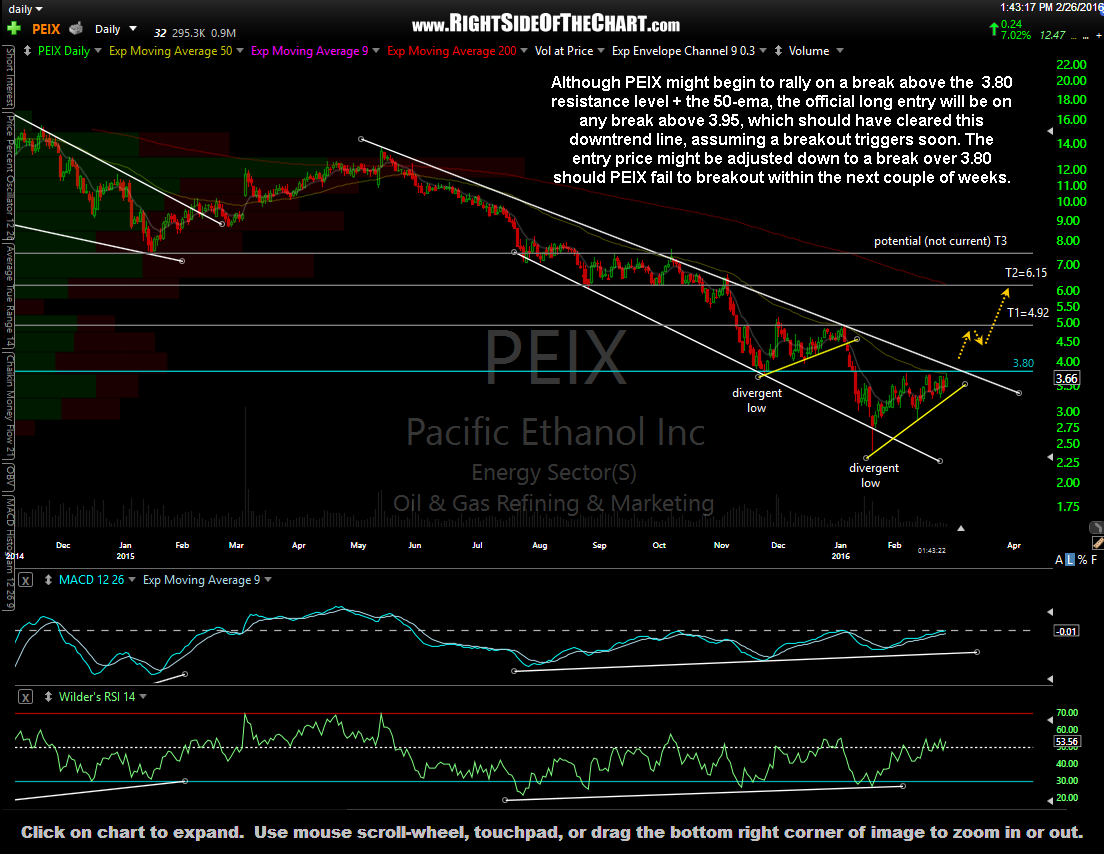
PEIX daily Feb 26th
Keep in mind a trade setup is just that… a setup that has yet to, and could very well fail to, trigger a long entry. Resistance is resistance until taken out so until we get some evidence of a potential trend reversal, an impulsive breakout & weekly close above the bullish falling wedge on the chart above being a start, PEIX is a stock in just off recent all-time lows that has been solidly entrenched in a vicious secular bear market for nearly a decade now. As a sub $5.00 stock, the risk of a large news-induced gap down is omnipresent until the fundamental prospects for this company firm up. Accordingly, consider the proper beta-adjustment to your position size, assuming this aggressive trade meshes with your risk-tolerance & trading style.