
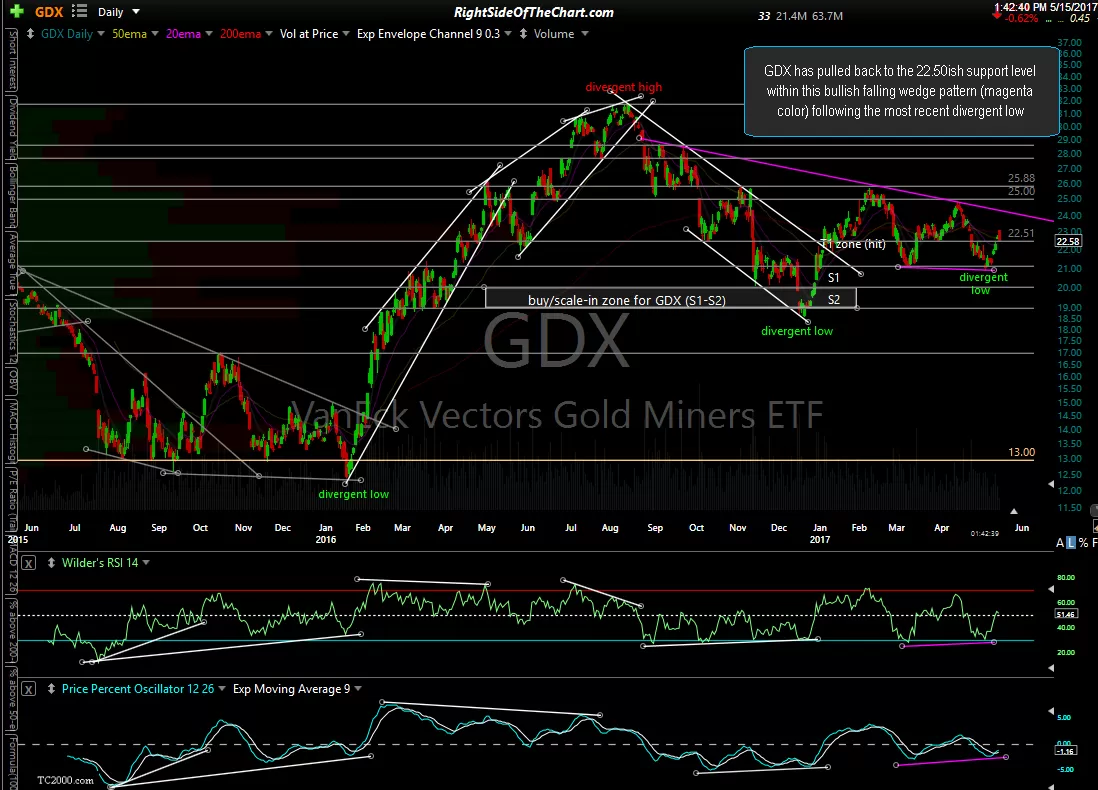
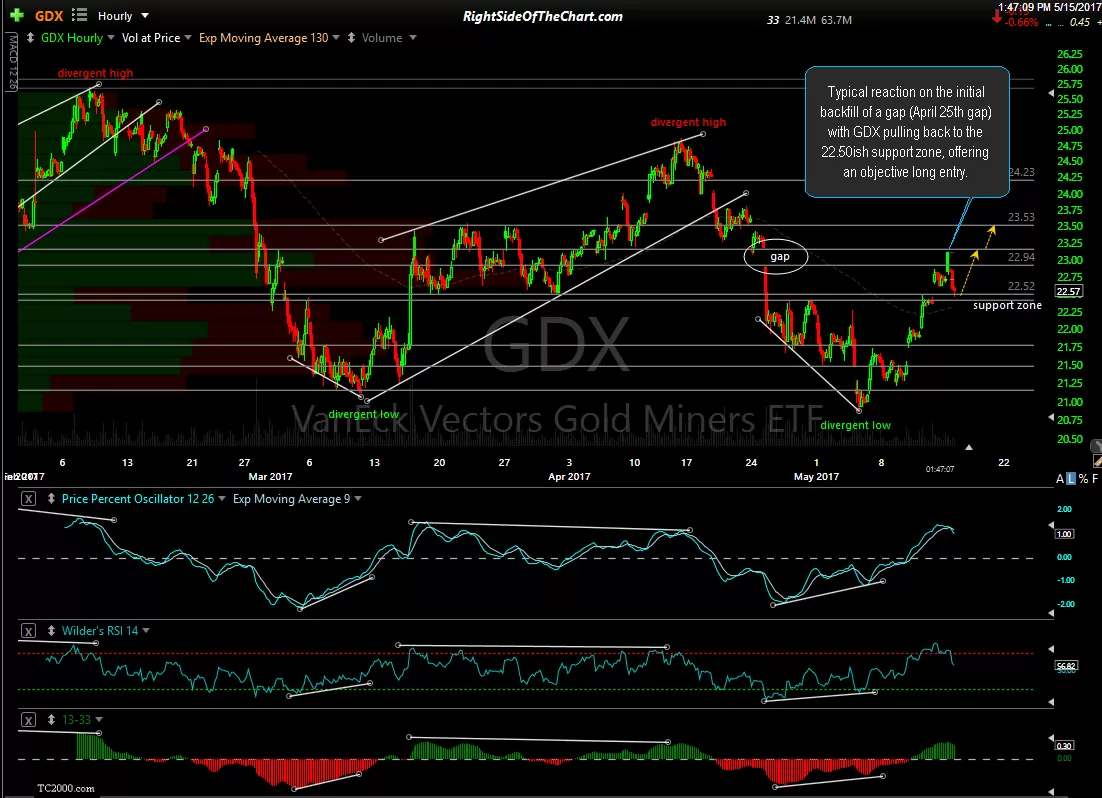
GDX (Gold Miners ETF) has pulled back to the 22.50ish support level within this bullish falling wedge pattern (magenta color) following the most recent divergent low & appears to offer an objective long entry for either a bounce trade & quite likely a multi-week/month swing trade. On the 60-minute chart (second) below, we can see the typical reaction on the initial backfill of a gap (the April 25th gap) earlier today with GDX pulling back to the 22.50ish support zone.
-
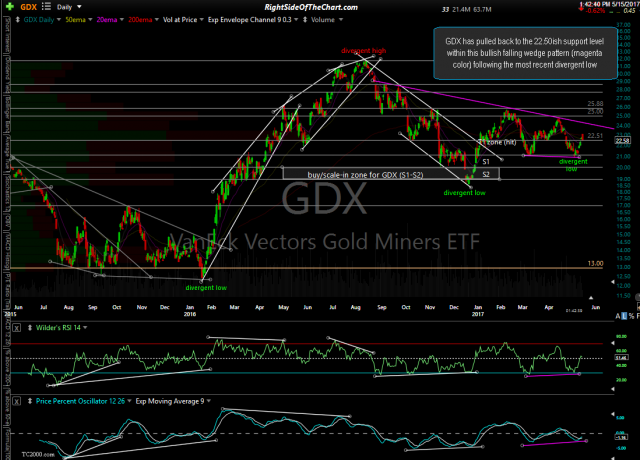
- GDX daily May 15th
-
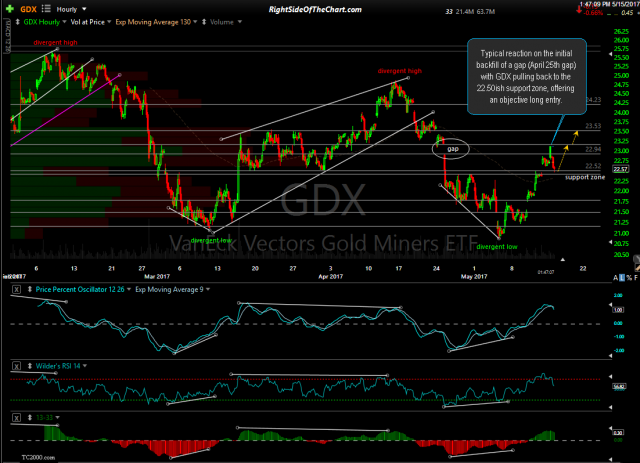
- GDX 60-minute May 15th
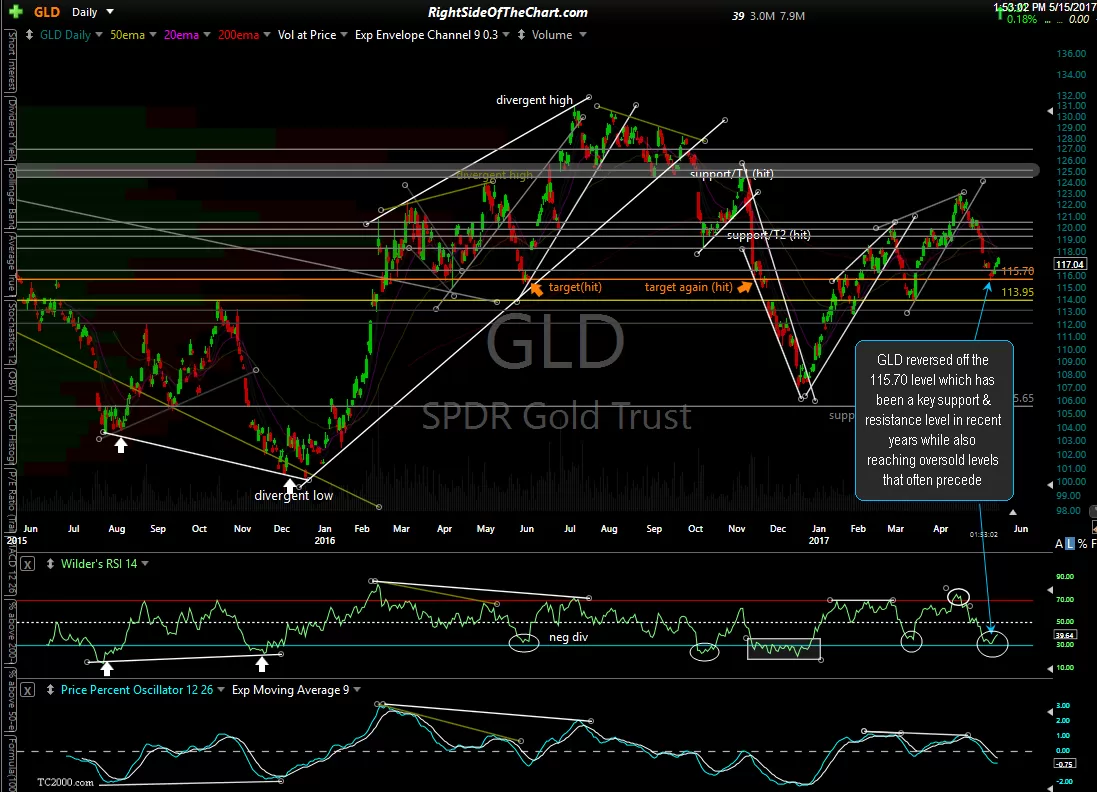
GDX will be added as an official Long Swing Trade around current levels. I plan to follow up with price targets & a suggest stop level(s) asap but just wanted to get this out before I study the charts in more detail to zero in on those levels. The suggested beta-adjustment at this time is 0.60 although I may increase that if the charts of gold & GDX continue to firm up. The daily & 60-minute charts of GLD (gold ETF) below help to confirm the near-term to intermediate-term bullish outlook for gold & the miners & it does appear that there is a good chance that the near-term bounce in the $USD that I was calling for a week or so ago may have run its course with the dollar likely headed lower in the coming weeks or months. I would also like to see the bearish case for the US Dollar firm up as well before increasing my position in GDX.
-
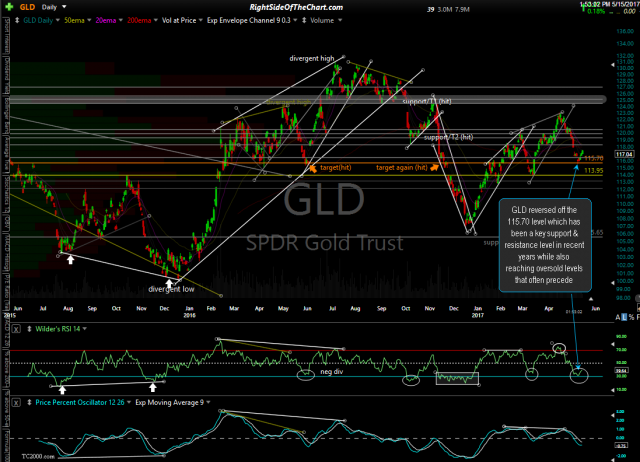
- GLD daily May 15th
-
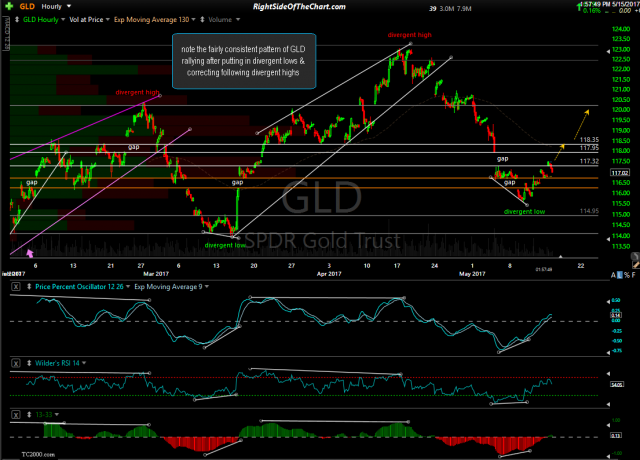
- GLD 60-minute May 15th
