Although not as diversified an index as the S&P 500 (which still remains on a intermediate-term sell signal via the 20/50 ema trend indicator, even as it closes up strong today), it is worth mentioning that the $DJIA (Dow Jones Industrials Index) triggered a bearish 20/50 ema “death cross” nearly two weeks before the S&P 500 and has remained on a intermediate-term sell signal since. Yes, the other widely followed large-cap index, the $NDX (Nasdaq 100) has yet to trigger a sell signal via this indicator but then again, the $NDX is pretty much a proxy for the tech sector as it is not only very tech heavy but also excludes financial stocks, which are one of the largest components of the US economy & the other, more diversified indices.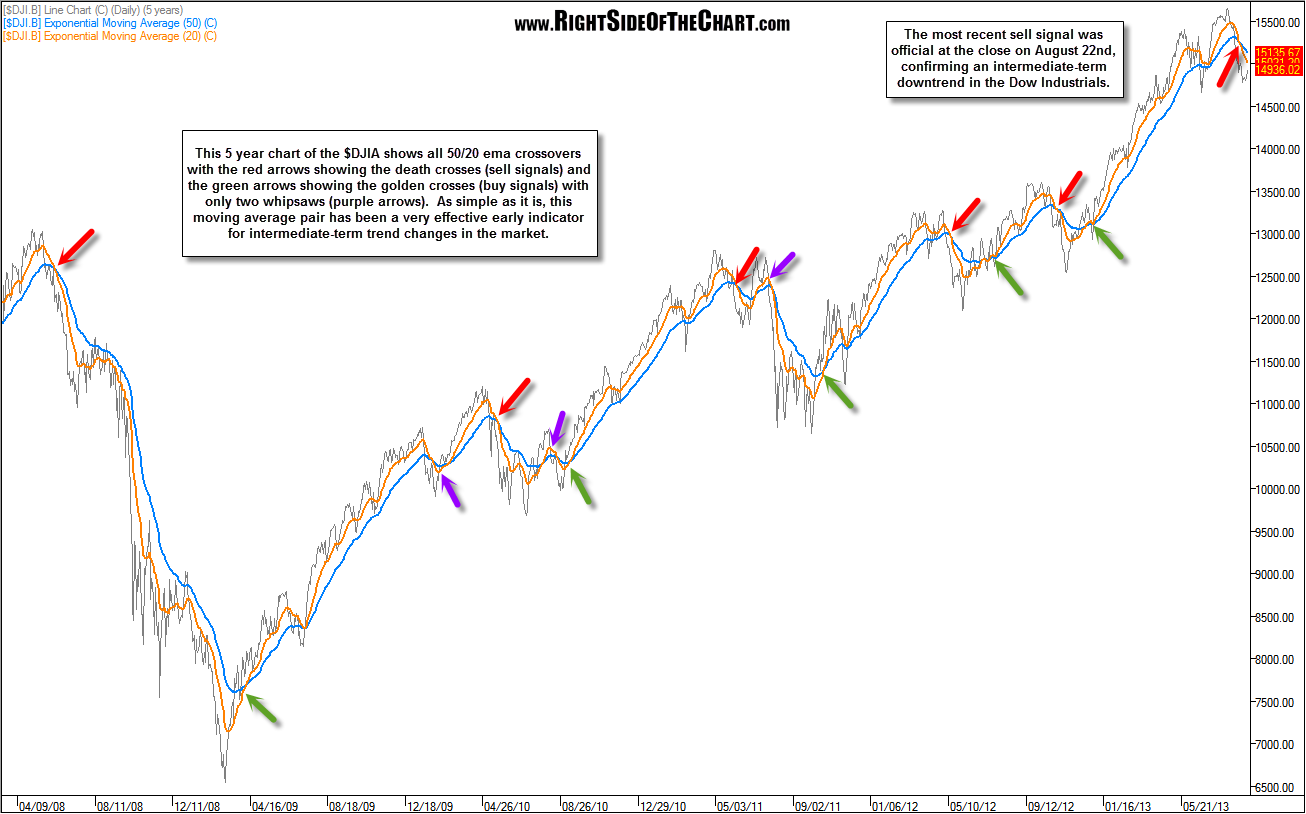 This 5 year chart of the $DJIA highlights the track record of this very simple, yet effective trend indicator, having signaled relatively early buy and sell signals for every major trend change with only two very brief whipsaws (false signals) over this time span. Sometimes it seems that just when one indicator starts to show a history of working well is about when it stops working so like with all indicators & signals, this one is used most effective in conjunction with other technical and fundamental metrics. There is quite a mixed bag of bullish and bearish fundamentals and technicals right now and of course, all of the longer-term trend indicators still remain on solid buy signals with both the short & intermediate-term trends bearish at this time.
