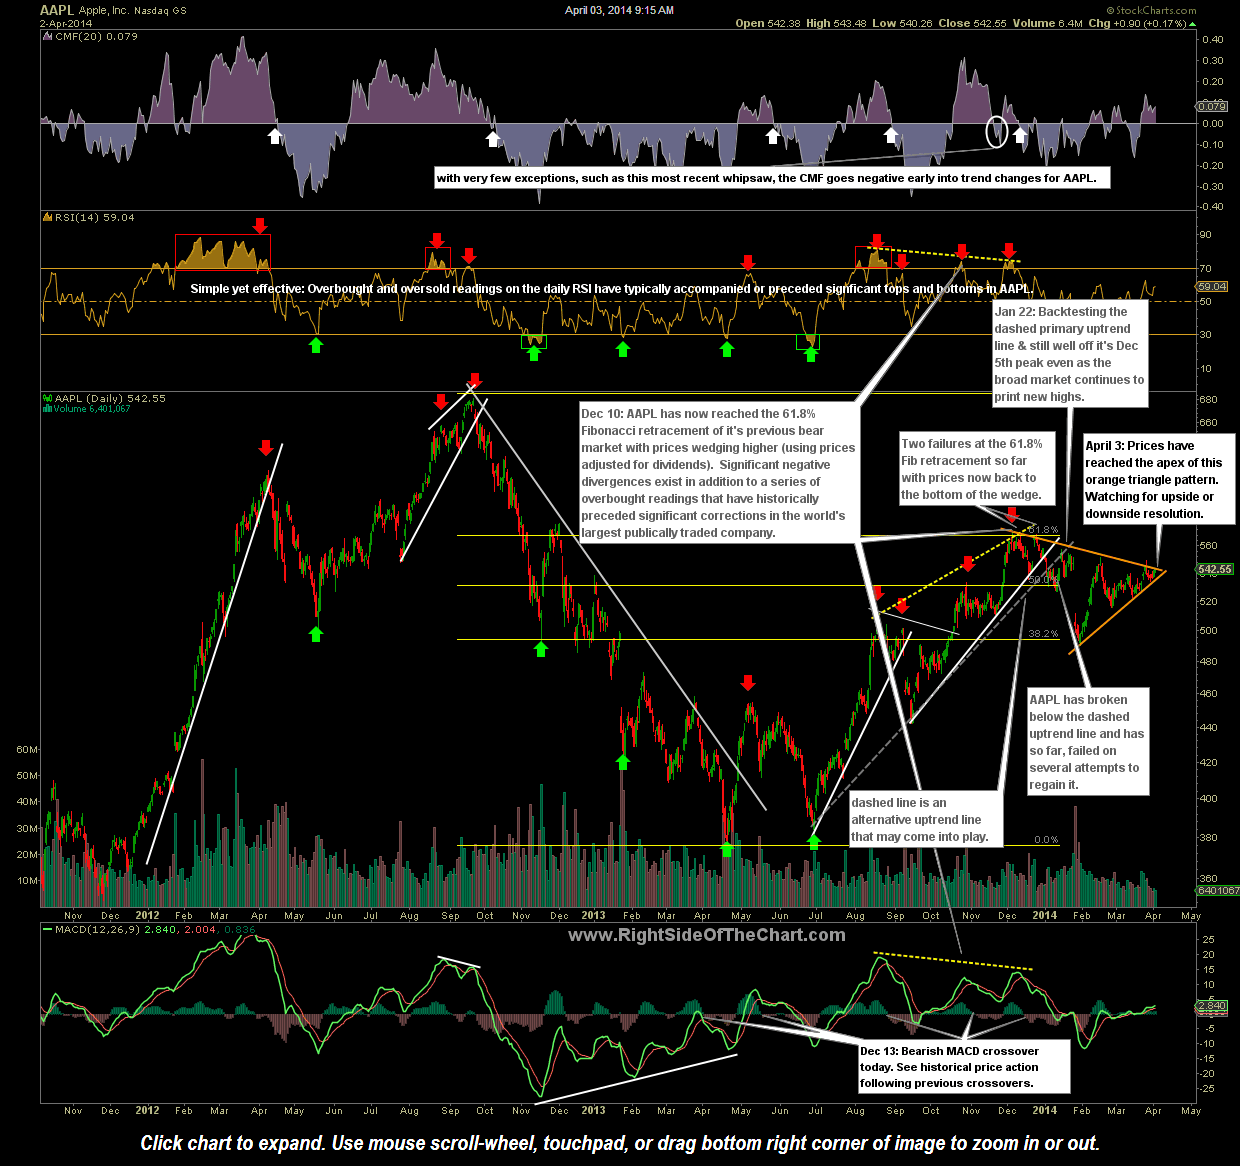
I’ll be watching AAPL (Apple Inc.) closely over the next few trading sessions as the price of this market leading stock is quickly closing in on the apex of this symmetrical triangle pattern. The downtrend line of that pattern is generated off of the Dec 5th peak in AAPL which came just two trading sessions before the AAPL Looking Increasingly Bearish post in which a detailed case was made for a correction in Apple. From that Dec 5th peak, AAPL fell about 13% (same percentage drop as the previous overbought cluster that was highlighted in that post).
Since the Dec 5th peak, AAPL has been trading in a contracting price range, i.e.- a symmetrical triangle pattern. Such patterns often prove to be continuation patterns with the stock breaking out in the direction of the previous trend. However, triangle patterns can break either way and it’s also not uncommon to see an initial “fake-out”, with prices breaking in one direction only to reverse and continue moving in the opposite direction shortly thereafter. Personally I have no interest in taking a position in AAPL regardless of which way prices move from here but as the world’s largest publicly traded company & the largest weighted component of both the S&P 500 and Nasdaq 100 Indices, it would be prudent to keep eye on the stock over the next few weeks.


