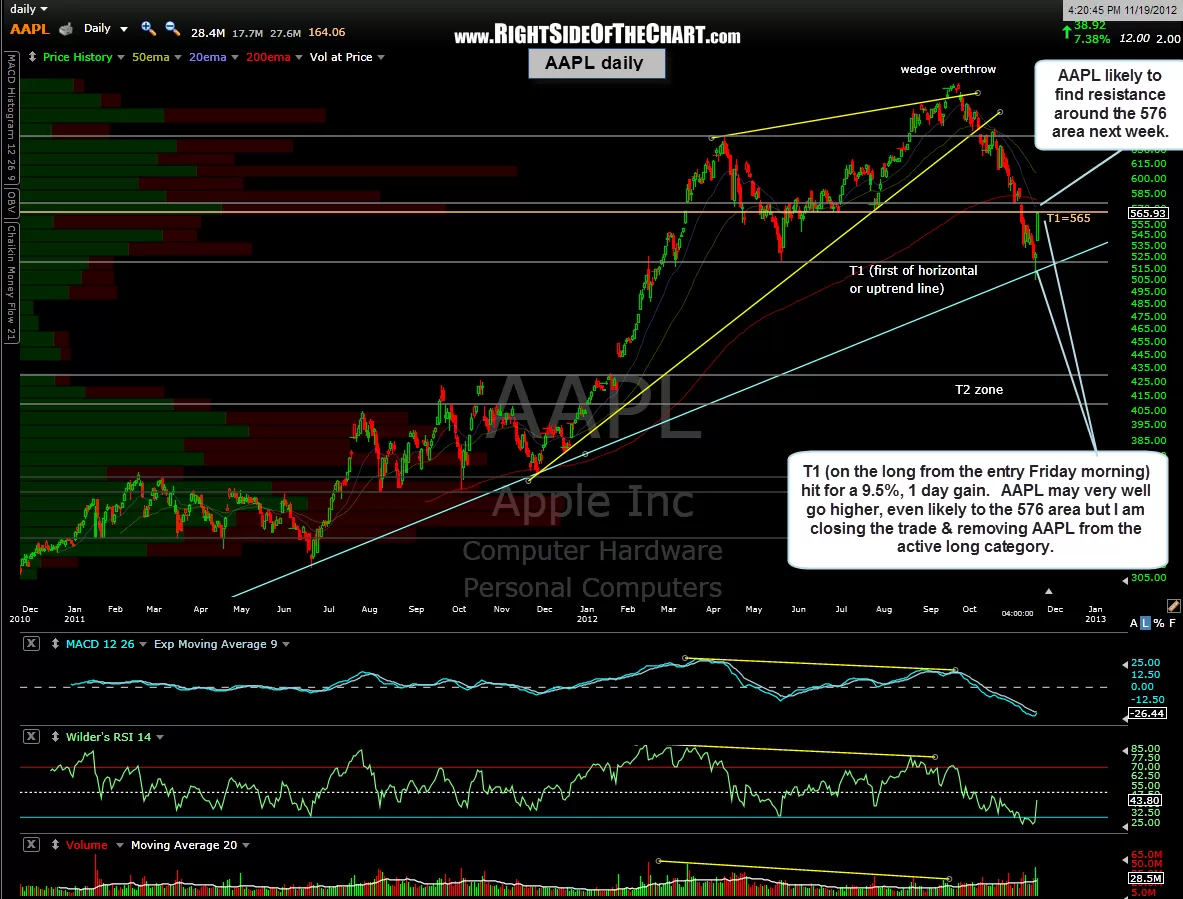
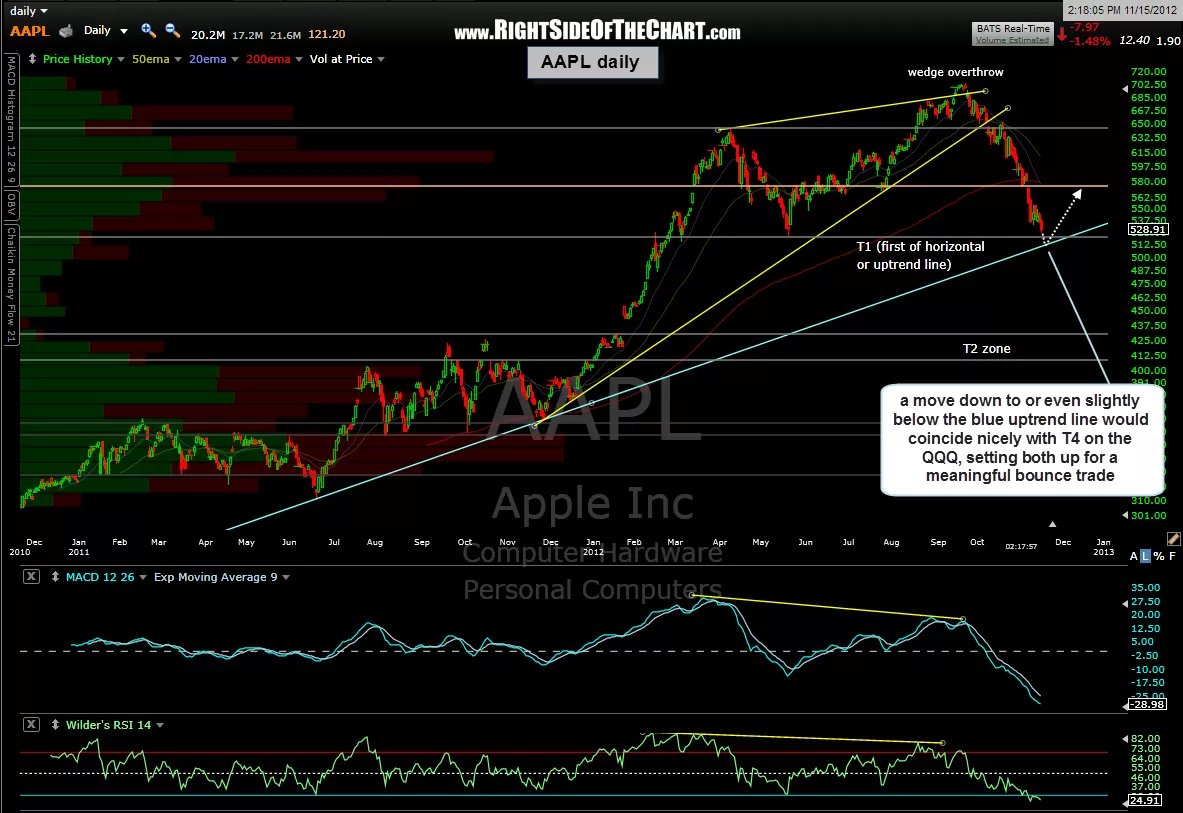
AAPL has hit the first and only target (565) on the long trade entered on Friday morning for a quick 9.5%+ gain. I personally sold all my shares including the last of my QQQ calls taken Friday as well. For those who took AAPL and would prefer to hold the stock (and I’m sure there are quite a few out there that do), I could easily see AAPL continuing higher to at least the 576 area, which is that grey horizontal resistance line as well as the 200ema on the updated daily chart below. As I only took AAPL as an oversold, bounce-off-key-support trade, I prefer to book full profits and risk giving some back holding out for a little more upside in the stock. In other words, I think that we milked the bulk of the favorable R/R out of this trade already, especially when considering the benefits of what I refer to as velocity in trading. I’m also winding down positions for the holiday shortened week as well. AAPL will now be removed from the Active Trades- Long category and I will likely be looking to add this trade back on as a short just below the 576 area, maybe even sometime this week.
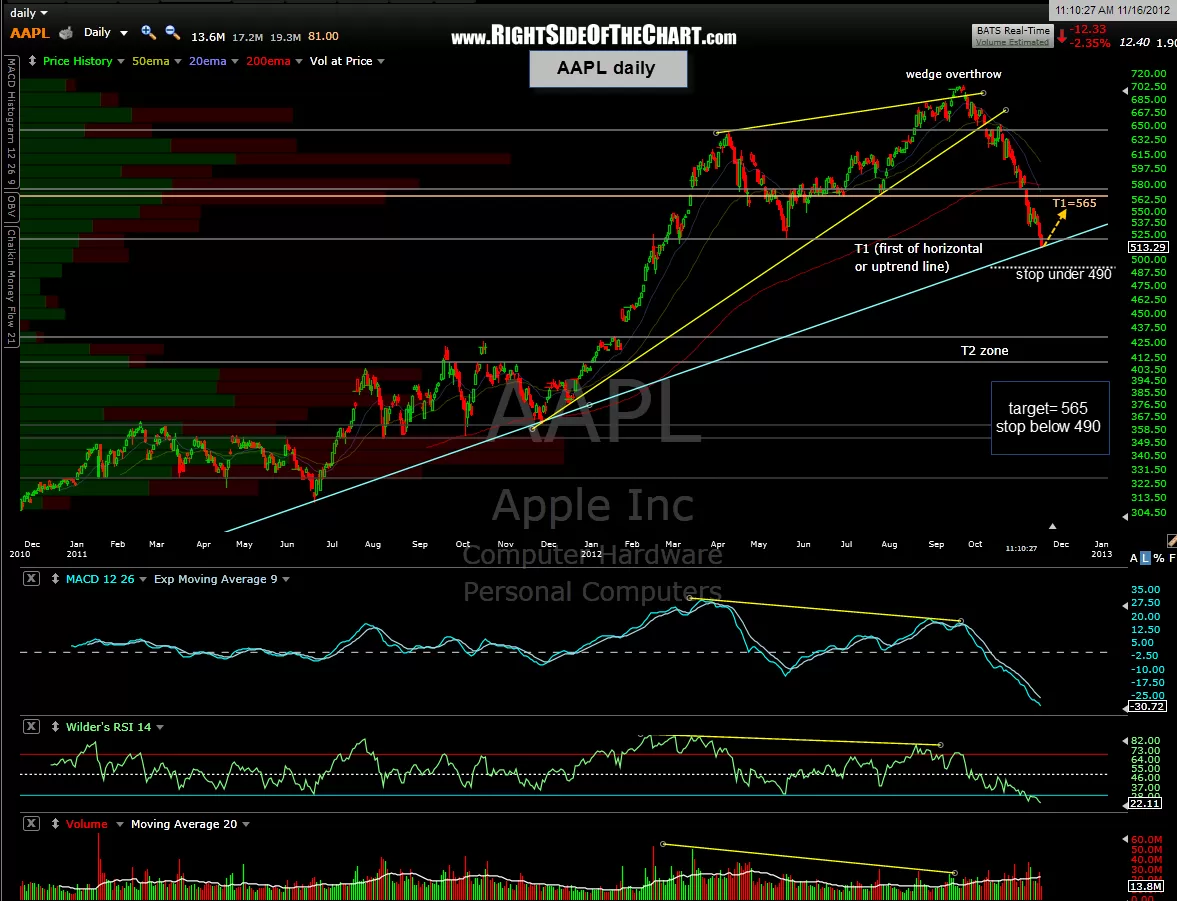
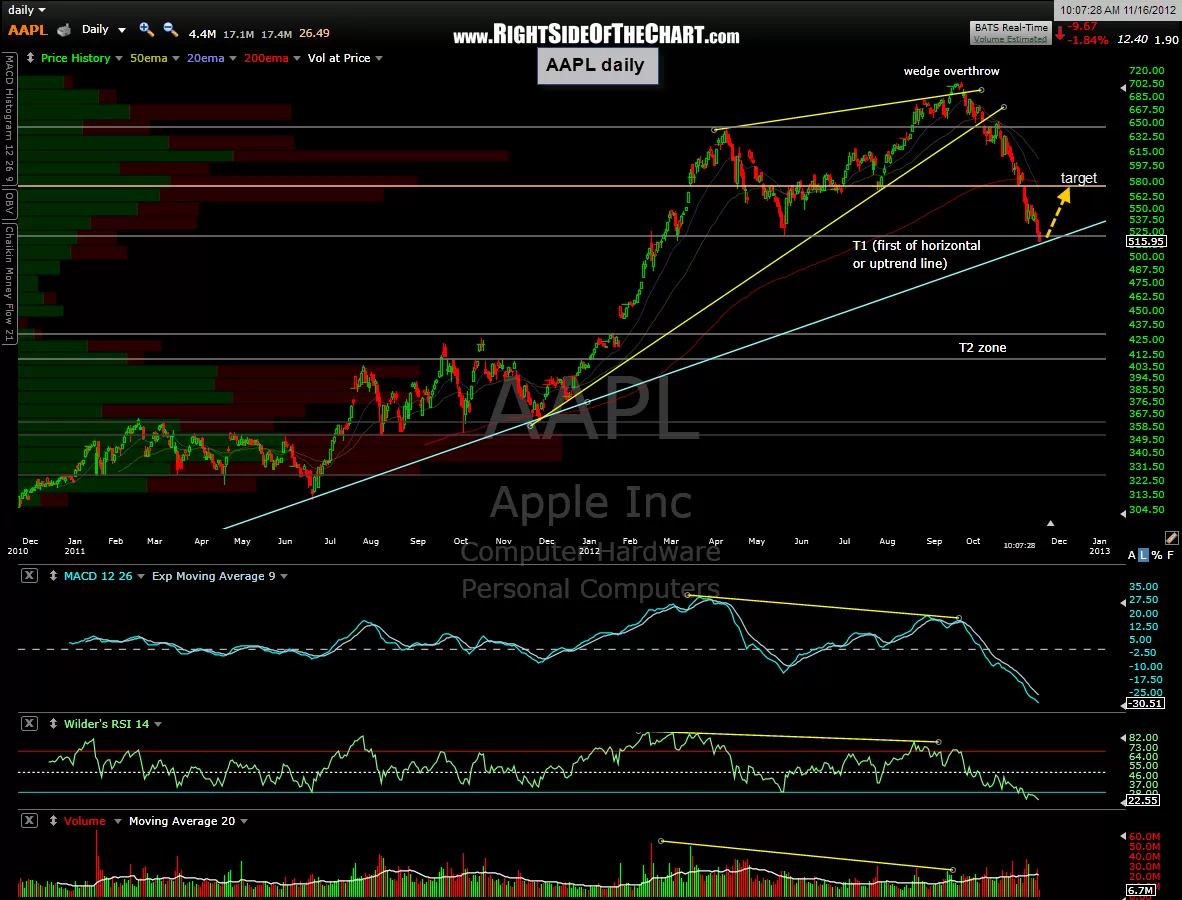
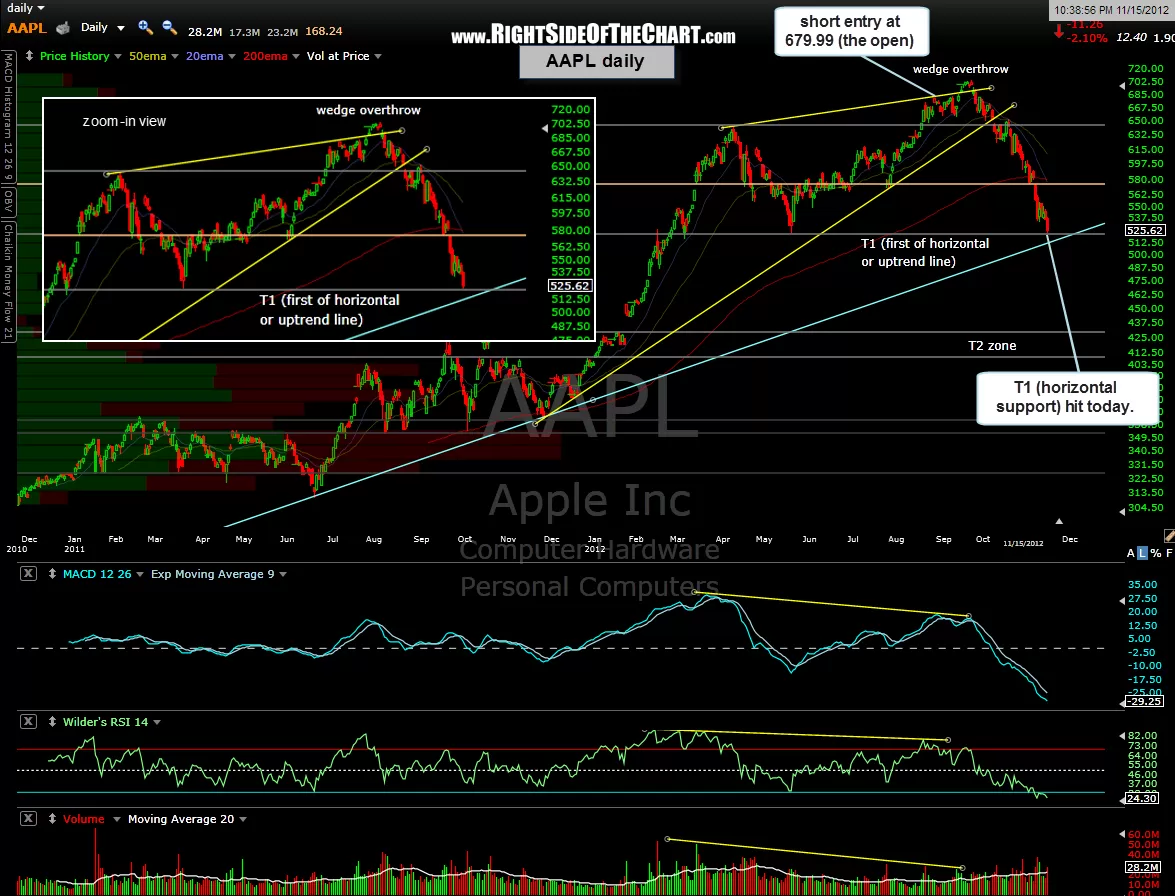
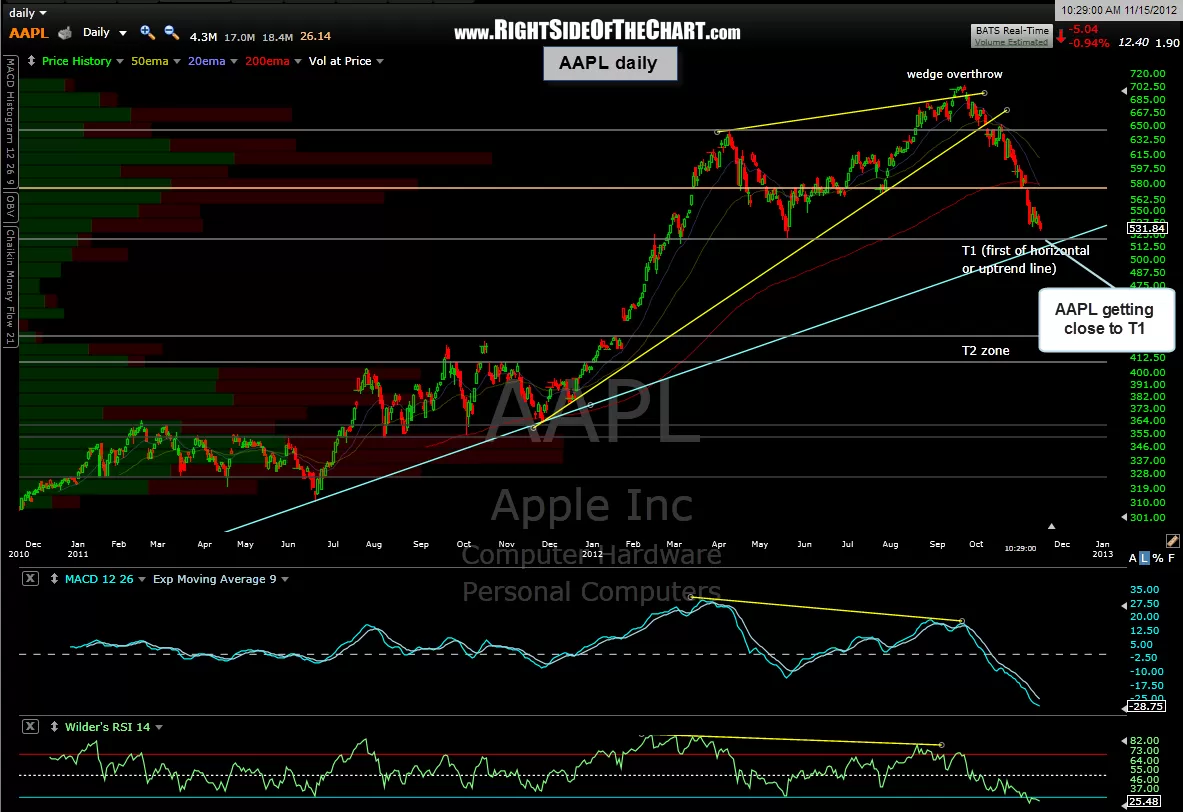
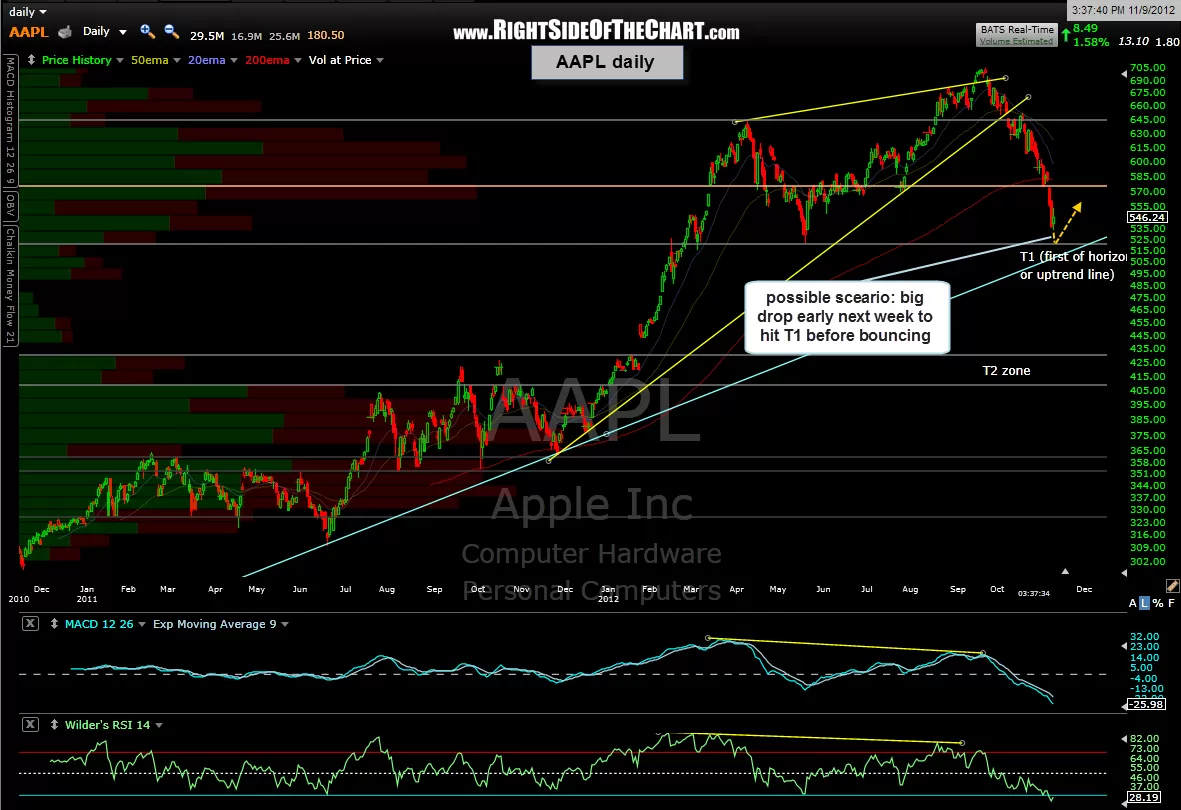
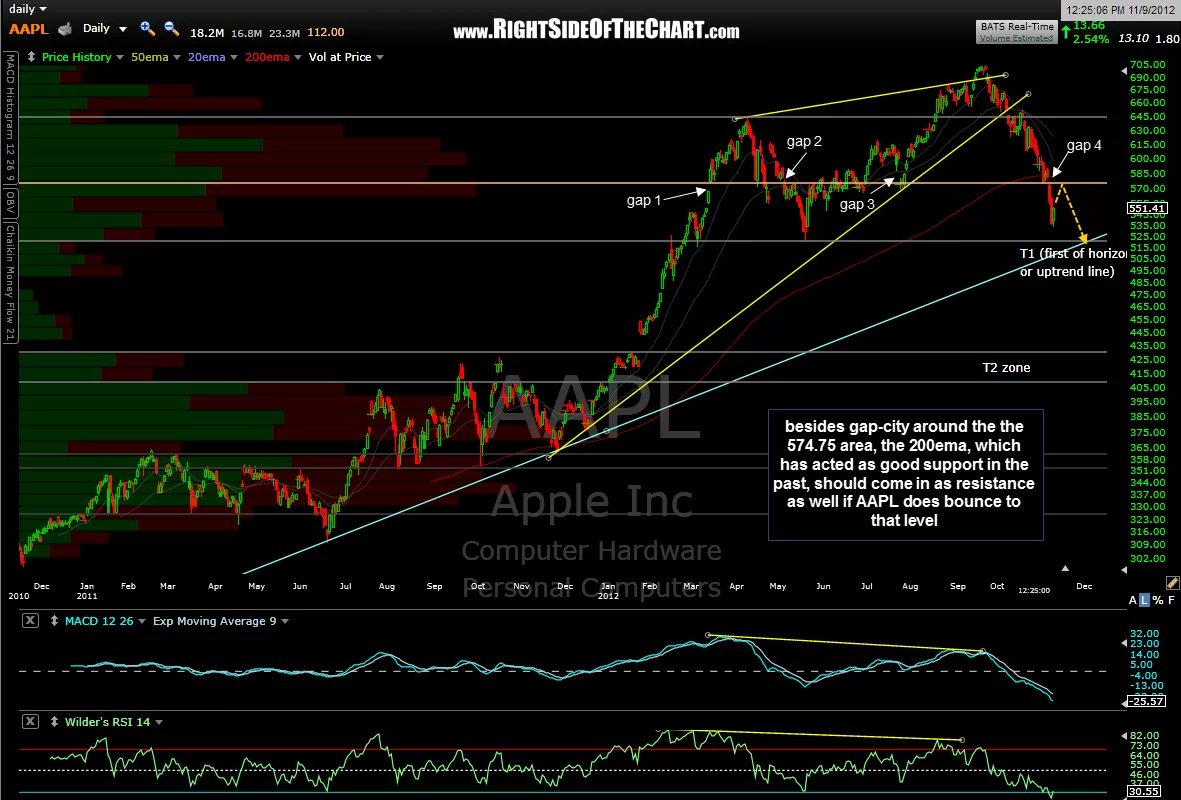
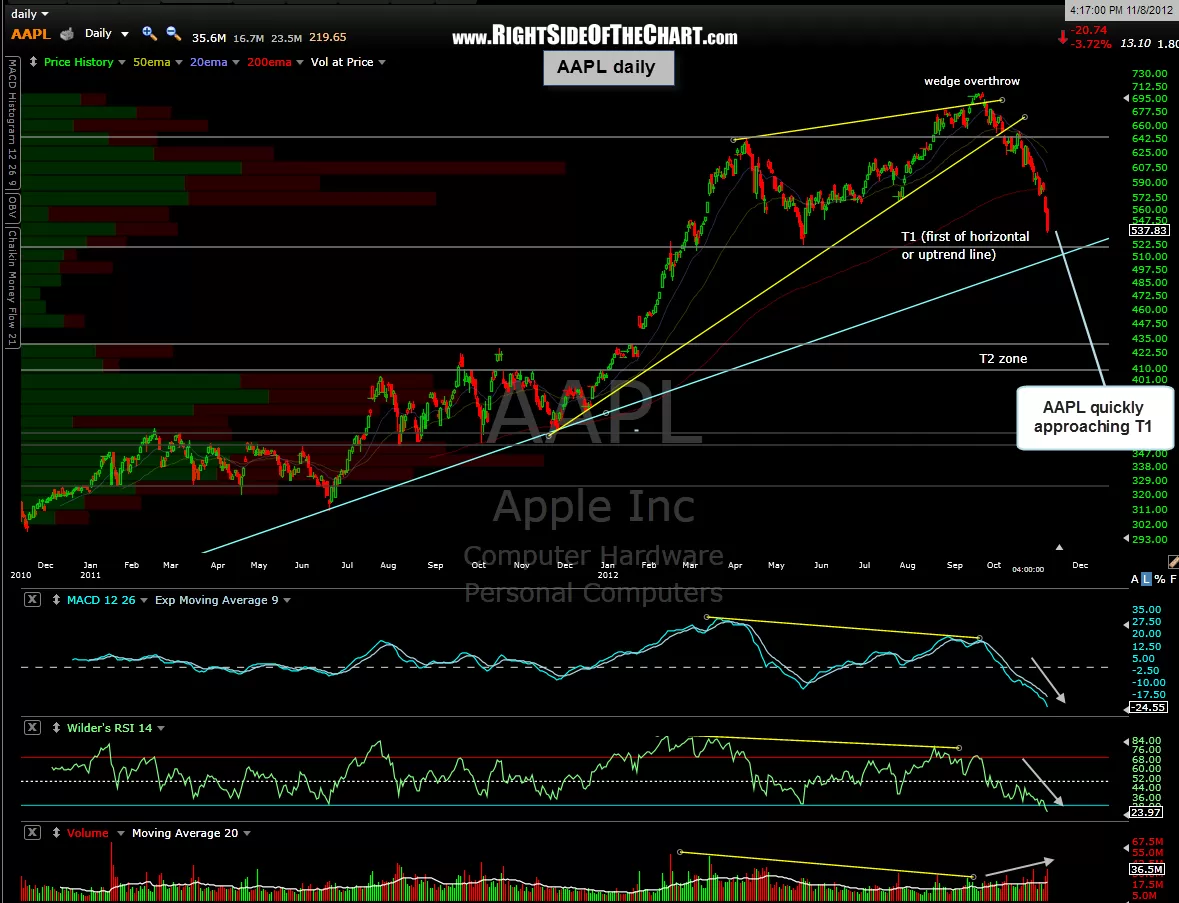
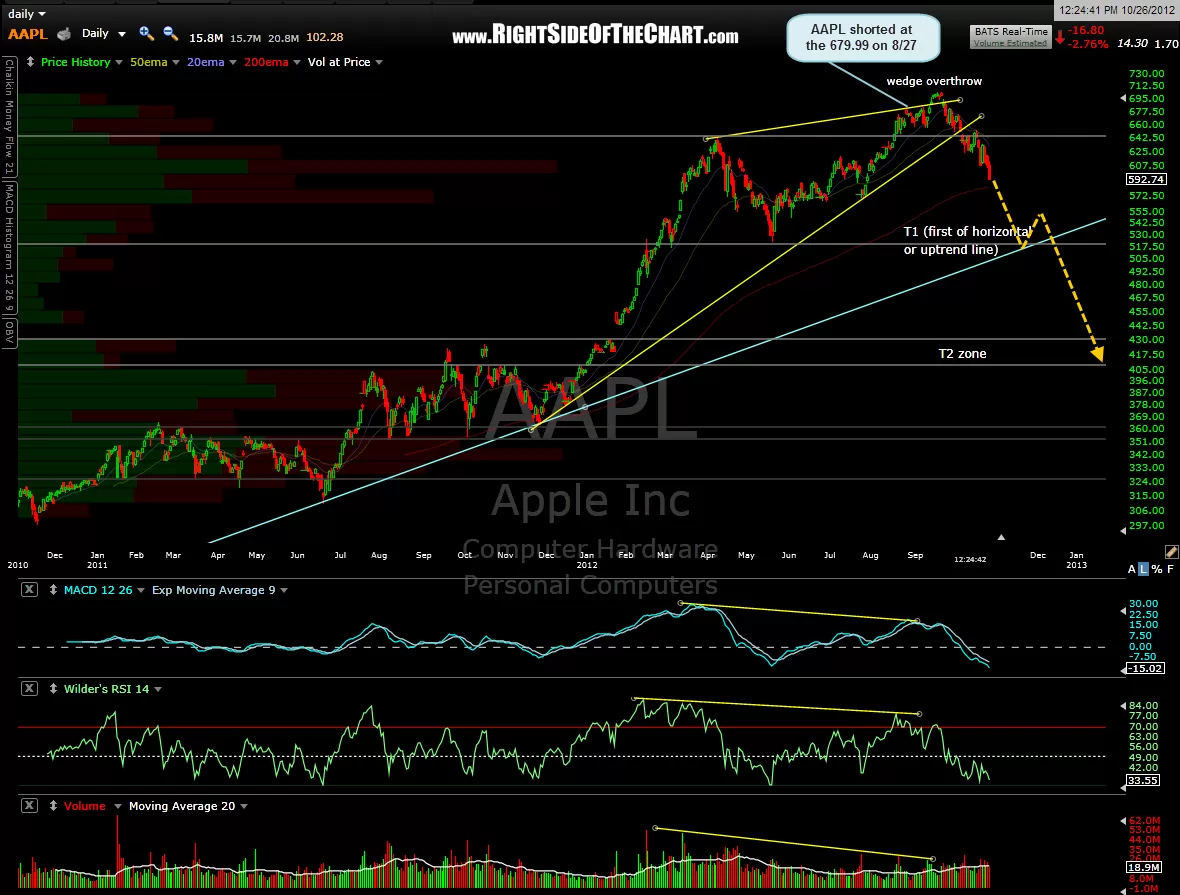
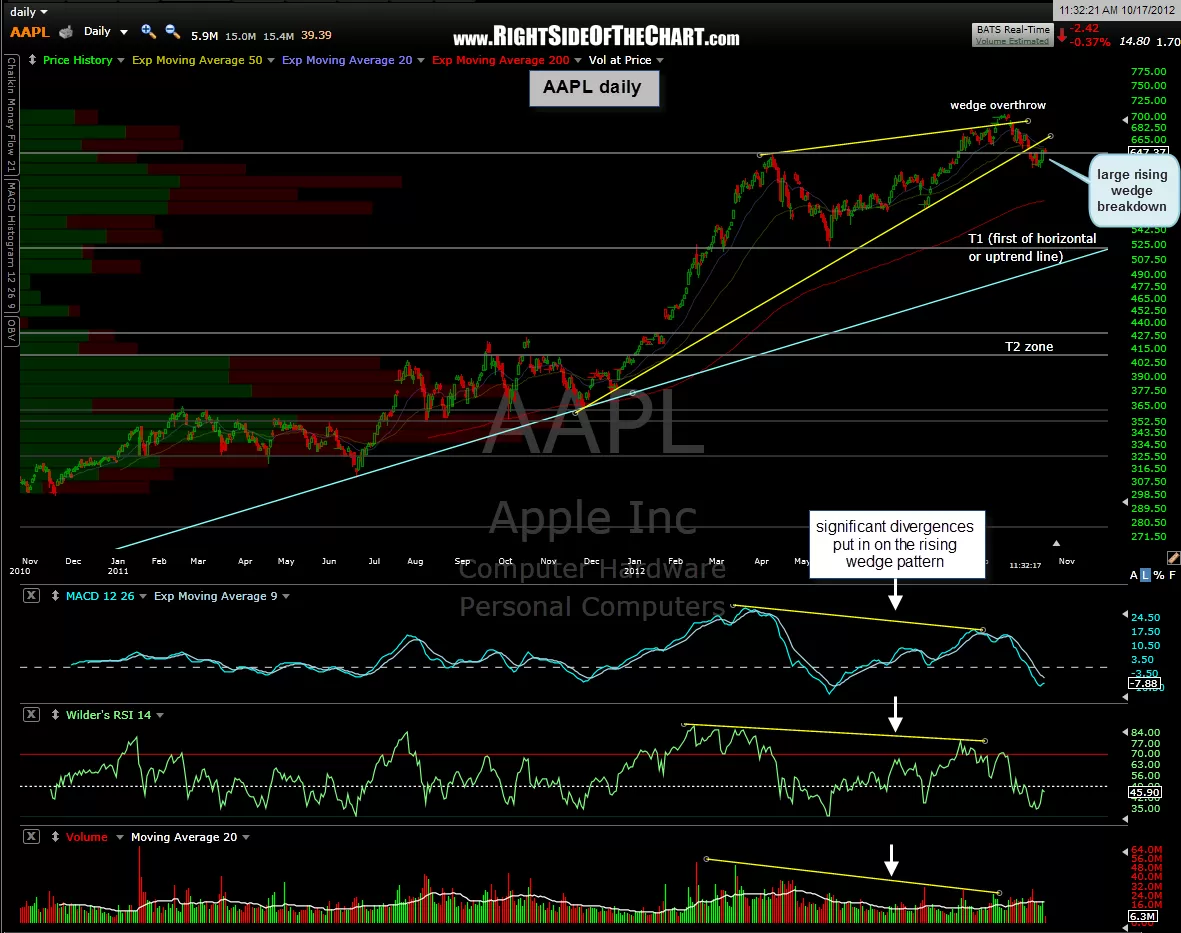
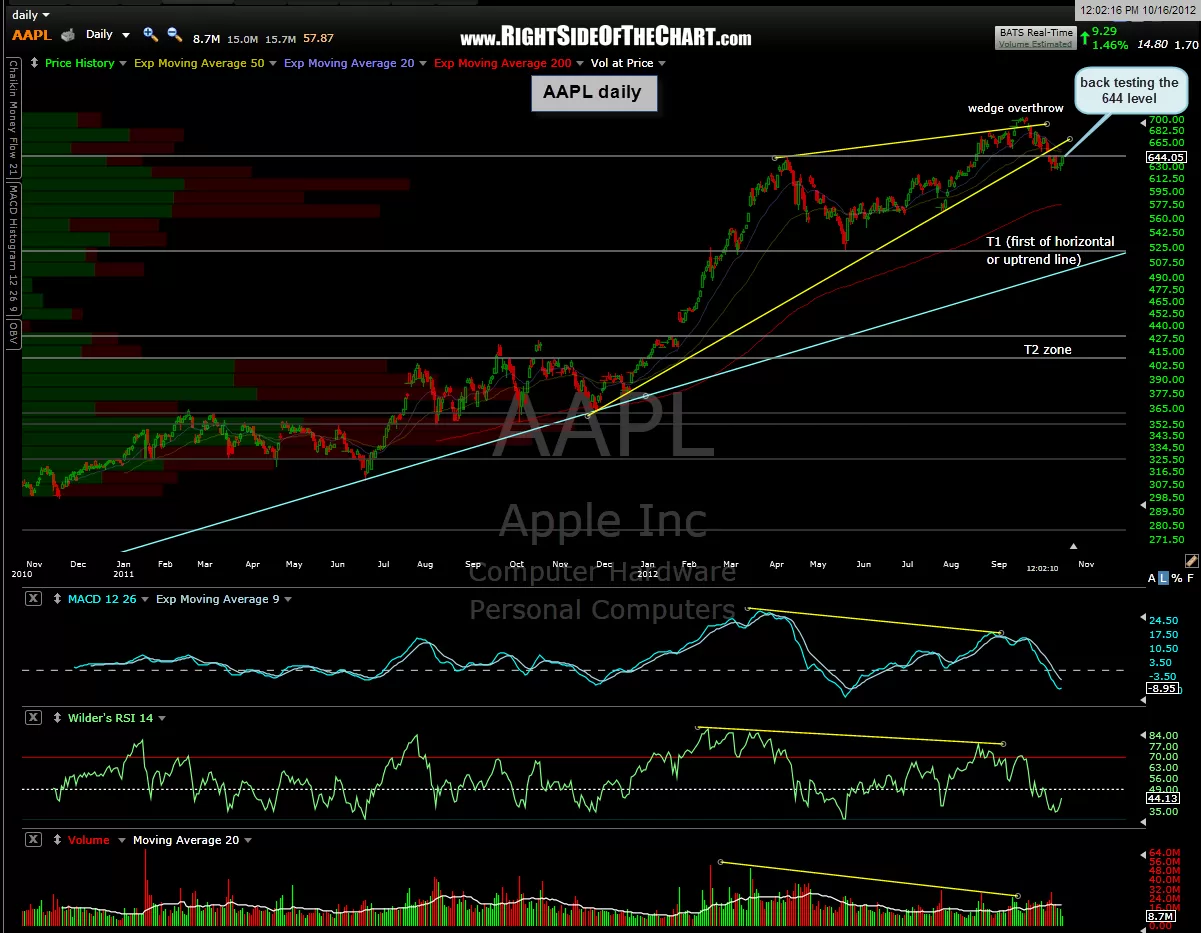
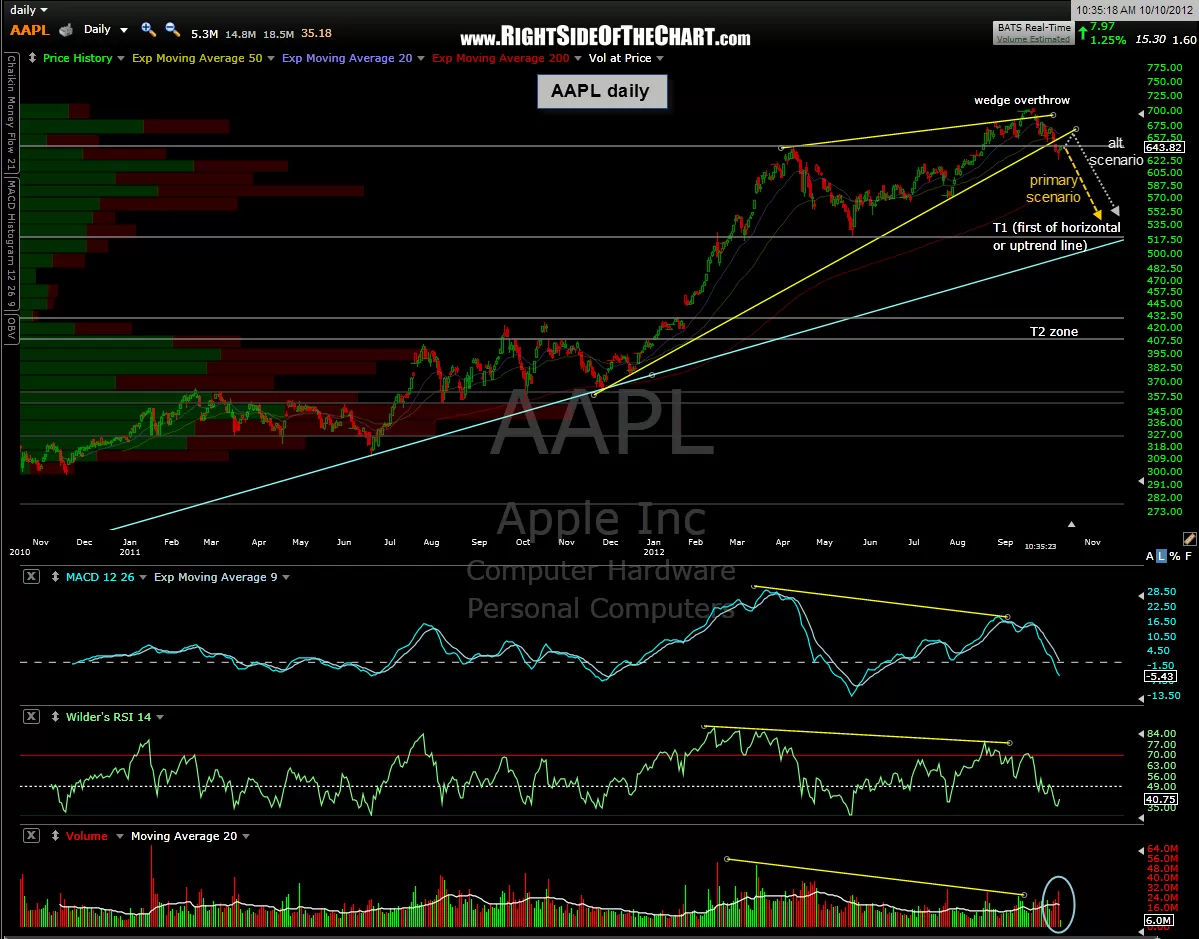
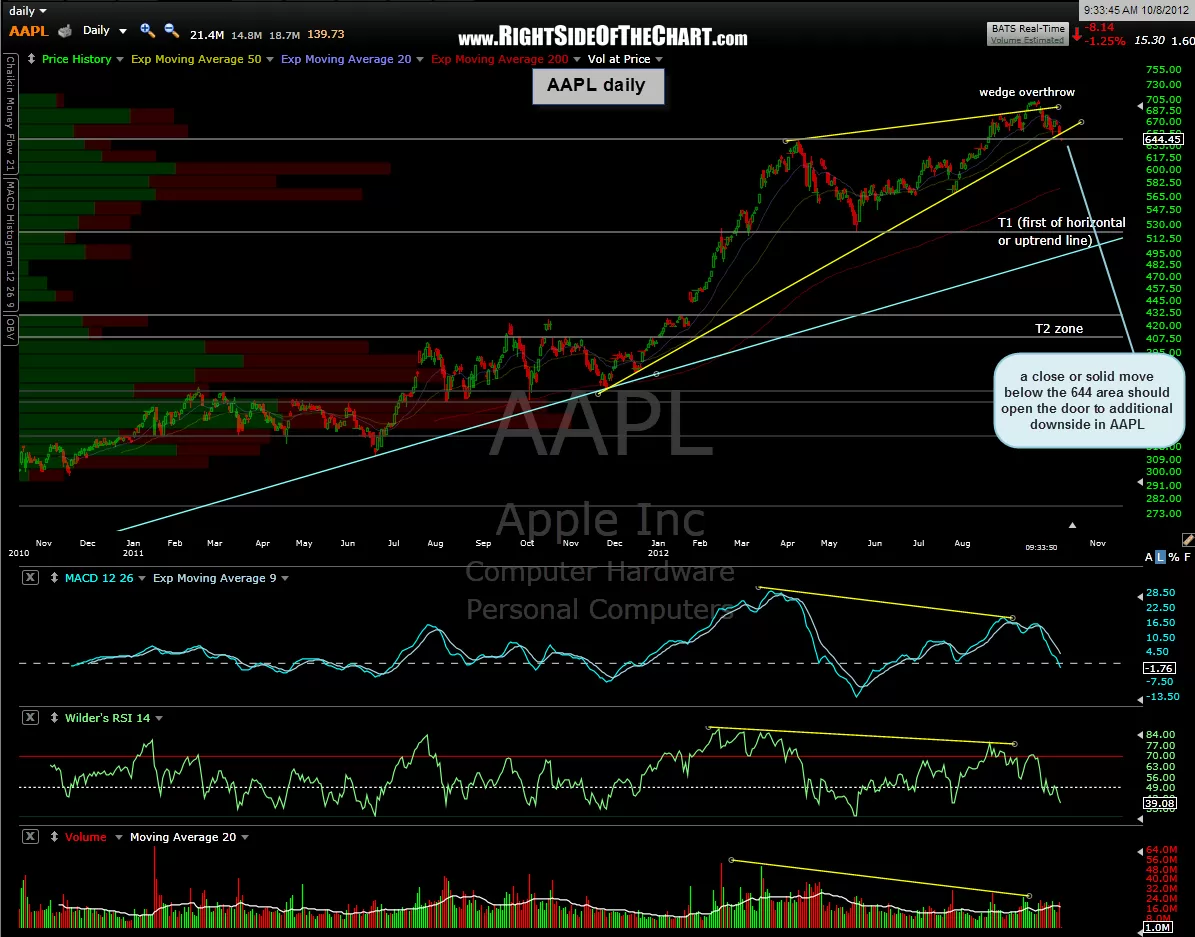
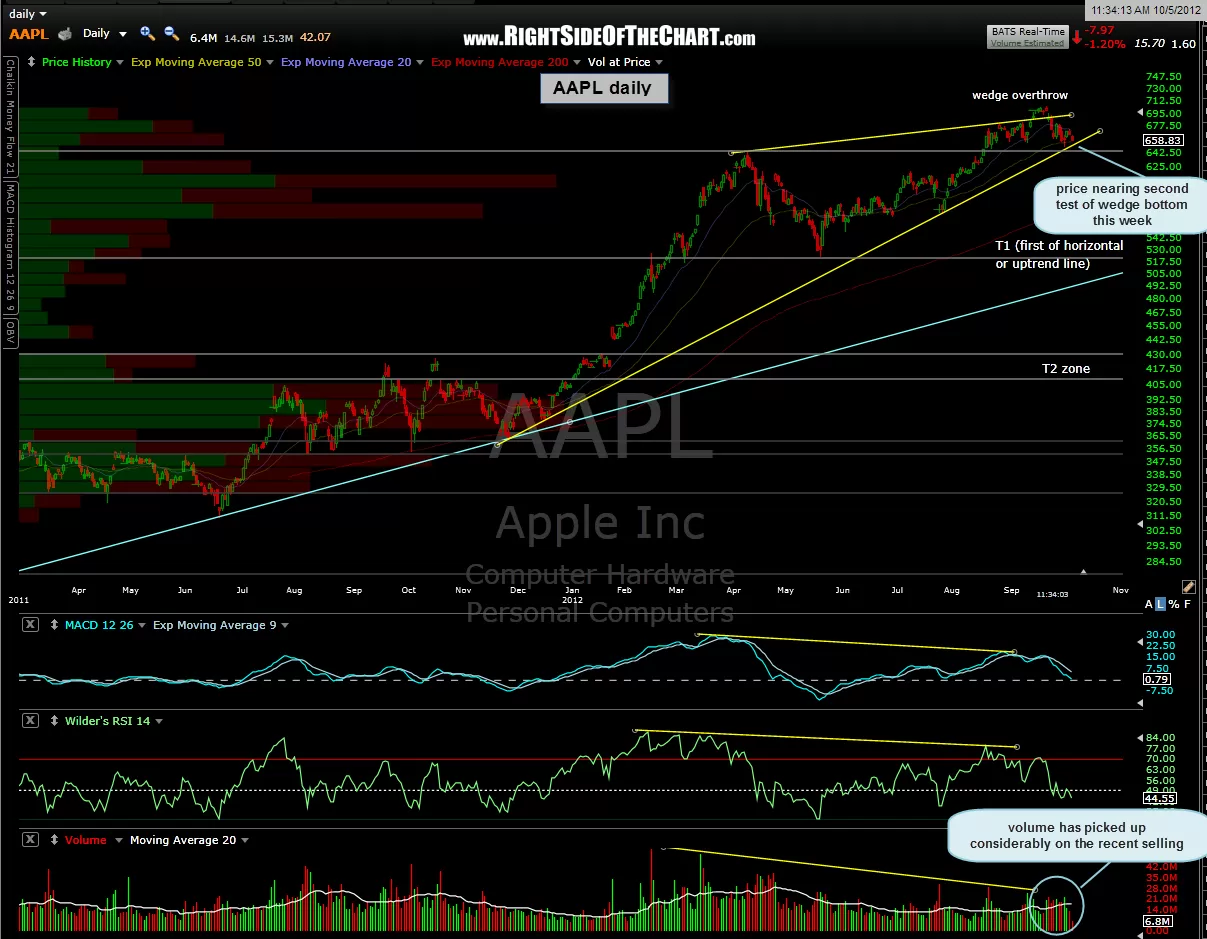
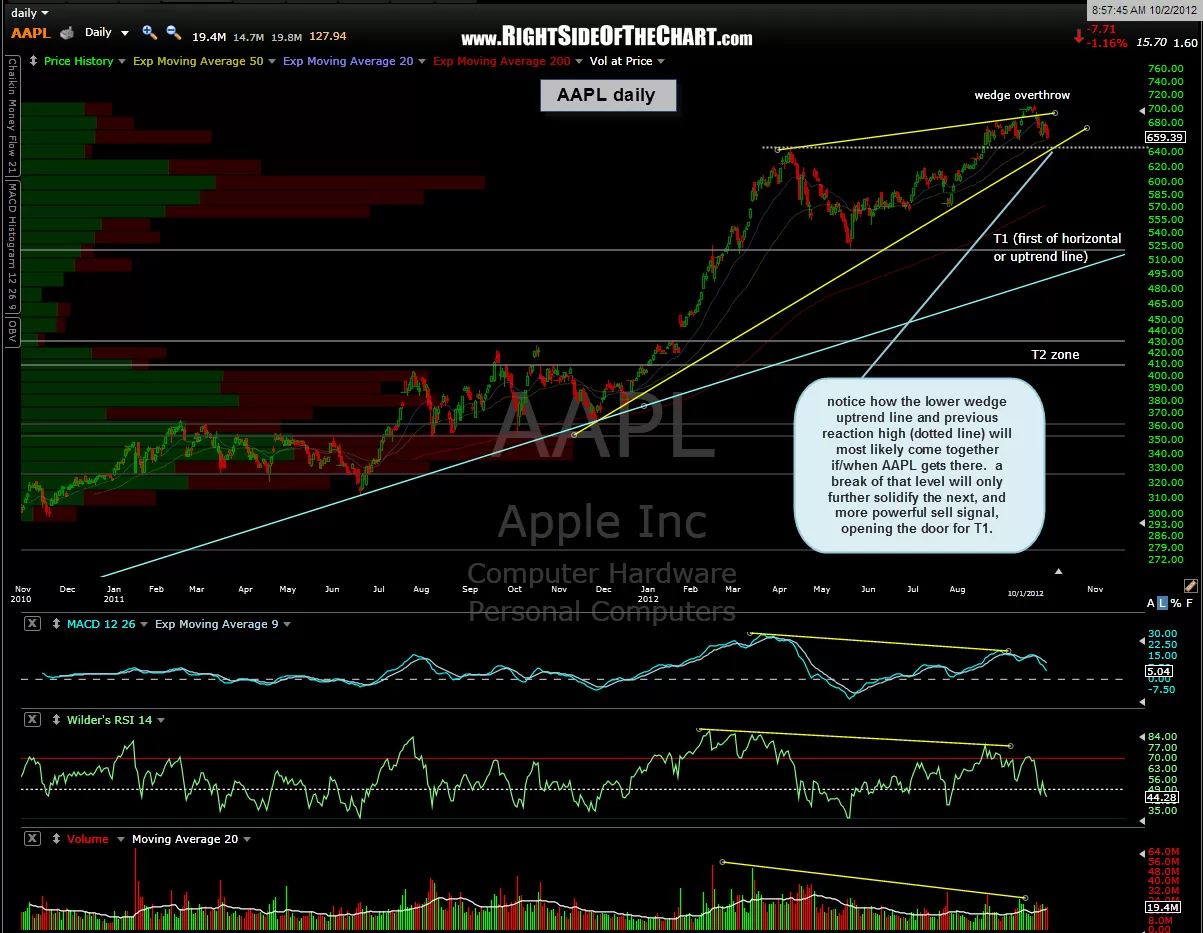
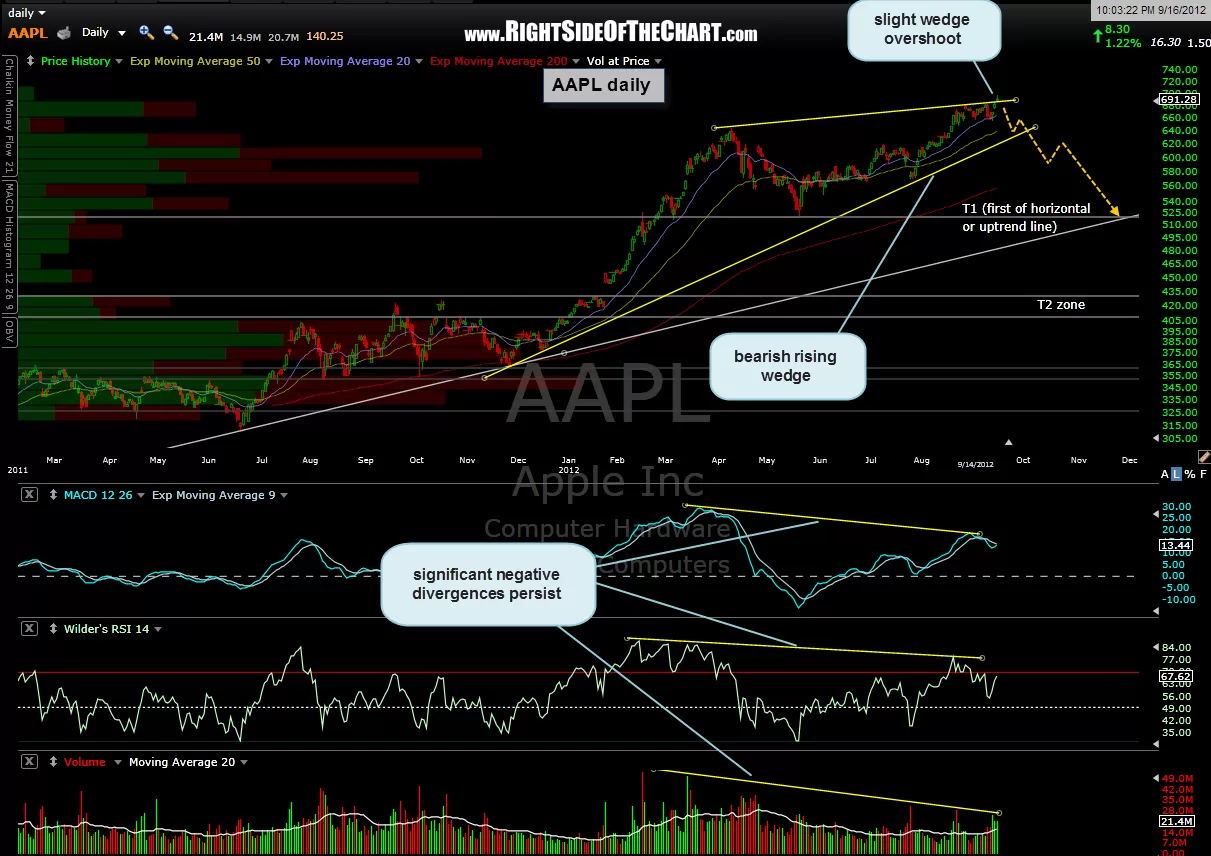
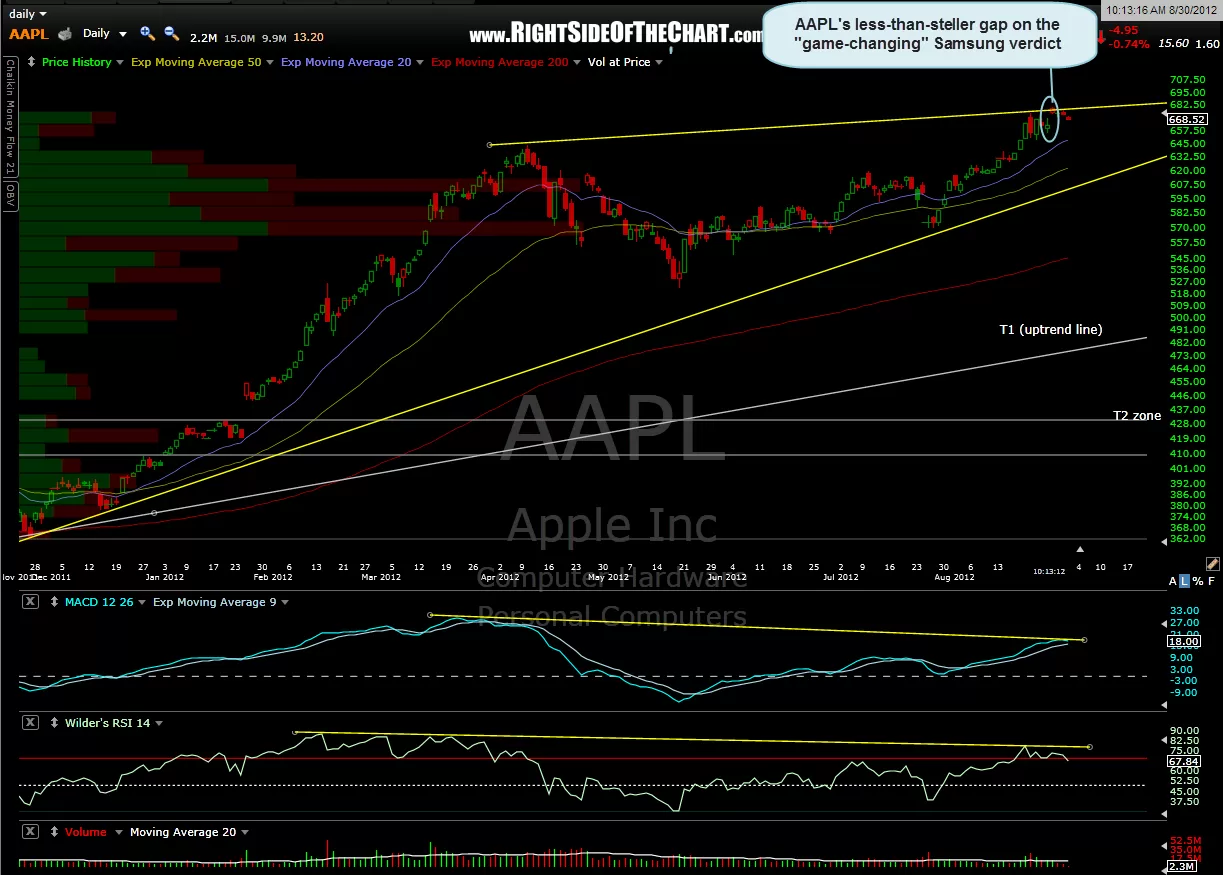
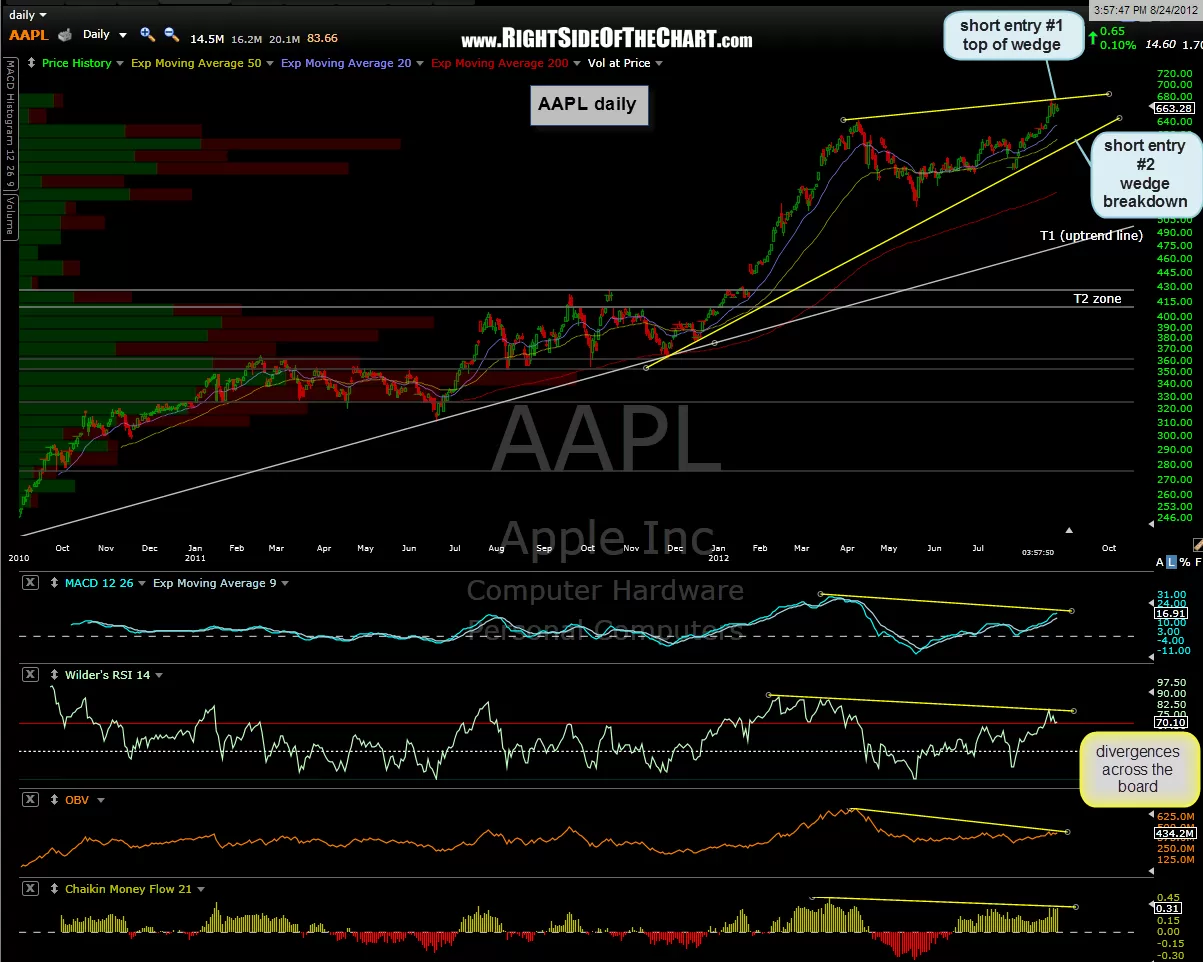
Congratulations for those that swung AAPL, or the QQQ, down short from the top and had the gumption or foresight to hold it all the way and then cover & reverse long yesterday. For those new to the site, here’s the recent string of AAPL daily charts starting with the original short entry post from after the close on Aug. 24th (with AAPL to be shorted at the next open, which was 679.99 on the 27th) all the way down to the first target being hit on Thursday and then a reversal to a long-entry on Friday morning around the lows. I will often reference the static charts on my past trades, both winners and losers, for educational value and I believe this is fine example of technical analysis combined with various of metrics not shown on the chart such as sentiment, the overall broad market outlook, etc…