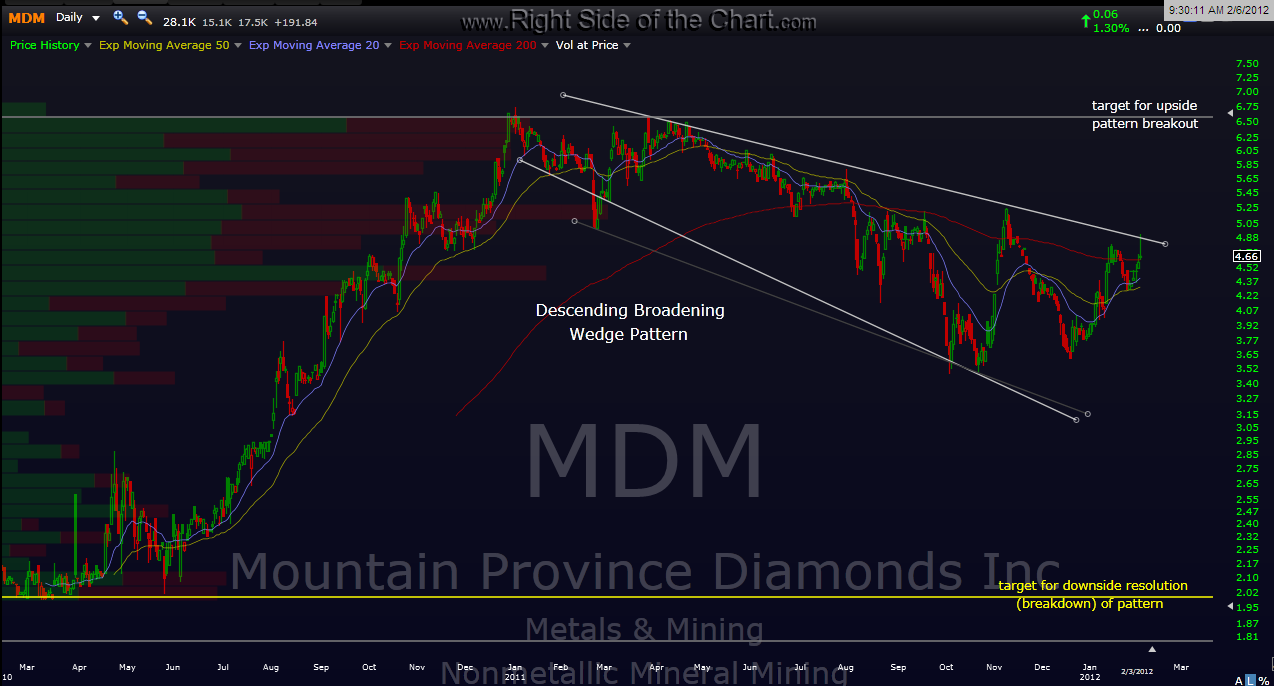
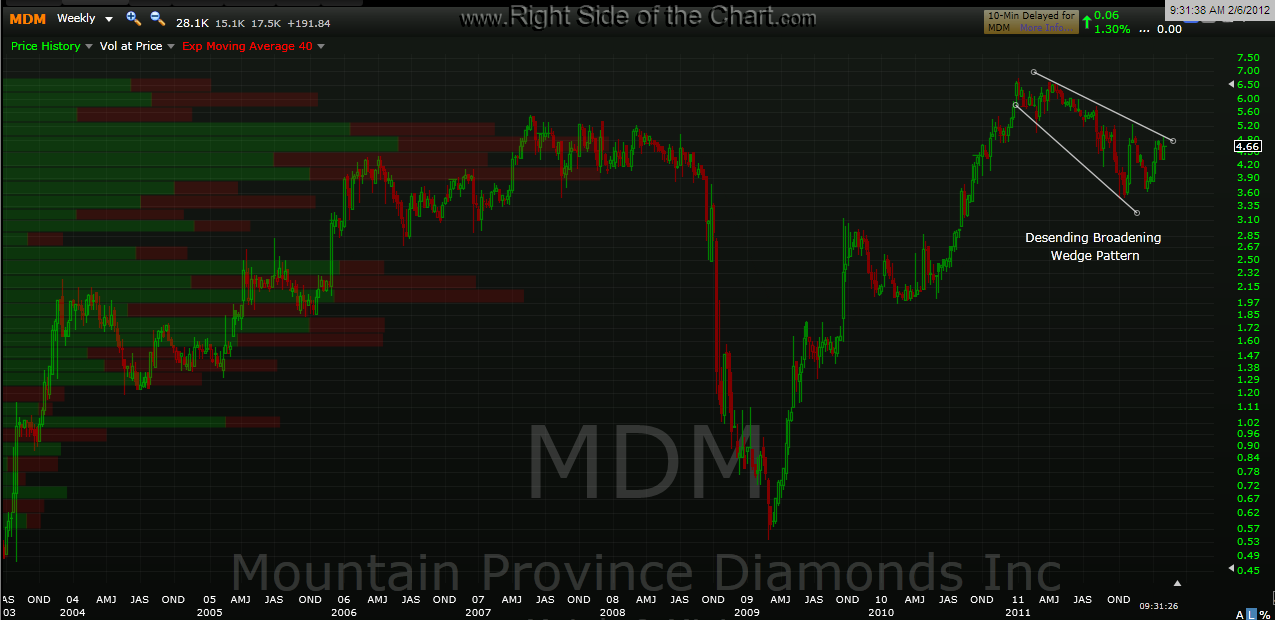
this pattern can break either way so targets are listed on the daily chart for a pattern resolution in either direction (long on an upside break of the pattern, short on a break down of the pattern). note that i did add an alternative (shaded) lower trendline to the pattern. however, prices currently sit at the very top of the wedge and therefore, i am currently watching for a potential upside breakout of the pattern. the weekly chart below shows the pattern well.

Results for {phrase} ({results_count} of {results_count_total})
Displaying {results_count} results of {results_count_total}