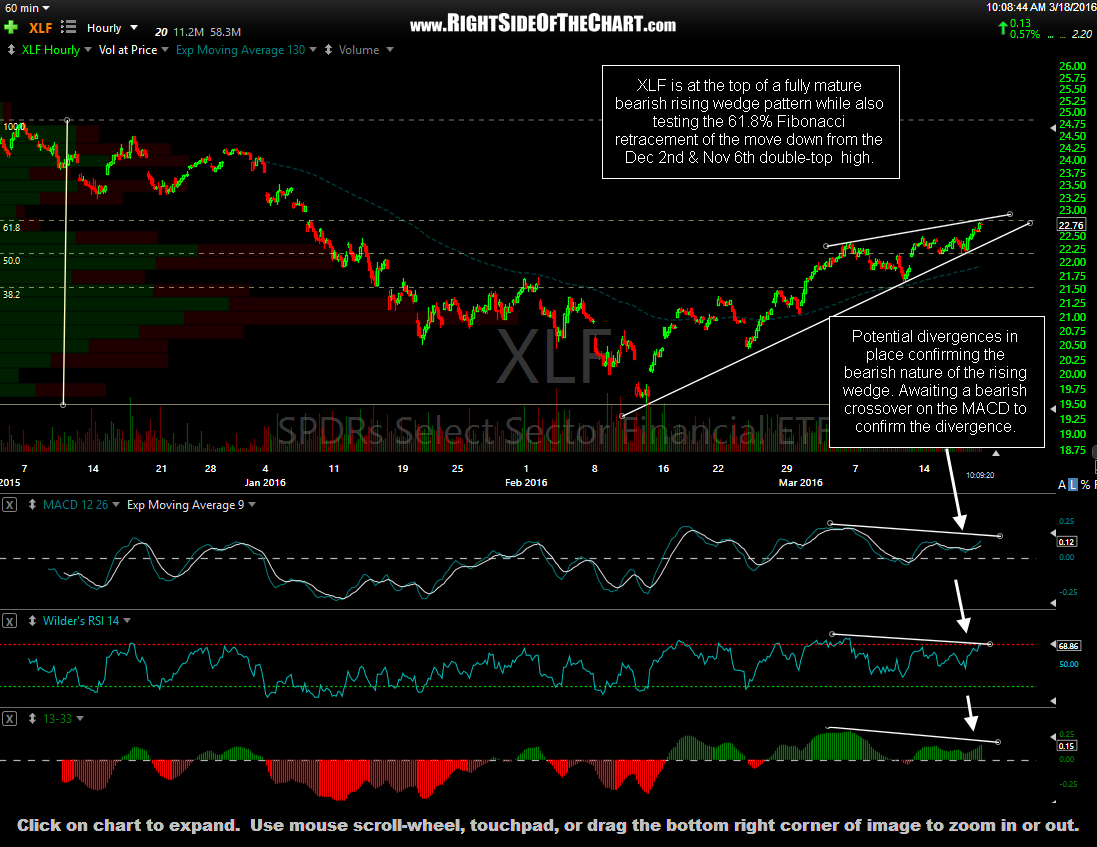
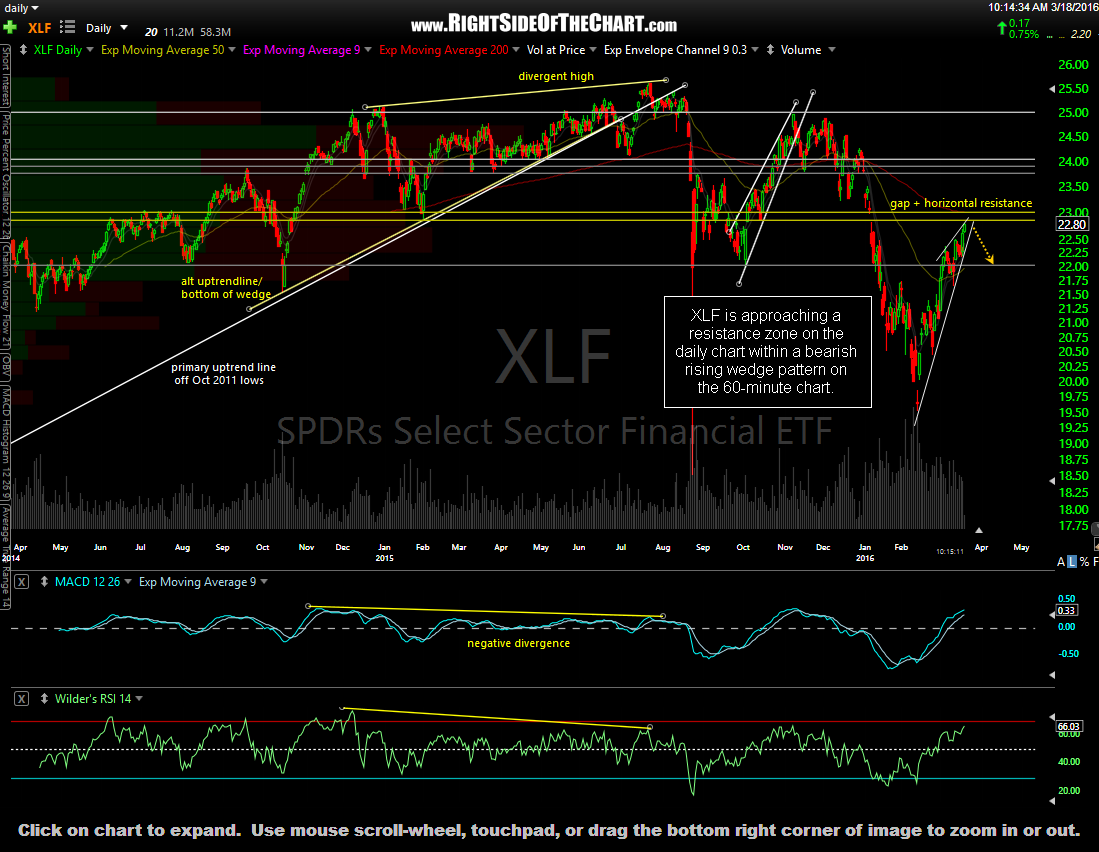
Member @trgfunds mentioned the financial stocks in the trading room as there are some interesting technical developments, I’d figure the charts were worth sharing. Essentially, XLF (Financial Sector ETF) is approaching a resistance zone on the daily chart. Of course resistance levels can an often are taken out however, at the same time XLF approaching that resistance zone while quite overbought in the near-term, the financials are also at the top of a fully mature bearish rising wedge pattern while also testing the 61.8% Fibonacci retracement of the move down from the Dec 2nd & Nov 6th double-top high. Potential divergences in place on most key indicators & oscillators bearish nature of the rising wedge. Awaiting a bearish crossover on the MACD to confirm the divergence along with a break below the rising wedge pattern for an objective short entry on XLF or the 3x bullish financials etf, FAS (both are unofficial trade idea at this time).
-

- XLF daily March 18th
-

- XLF 60-minute March 18th