
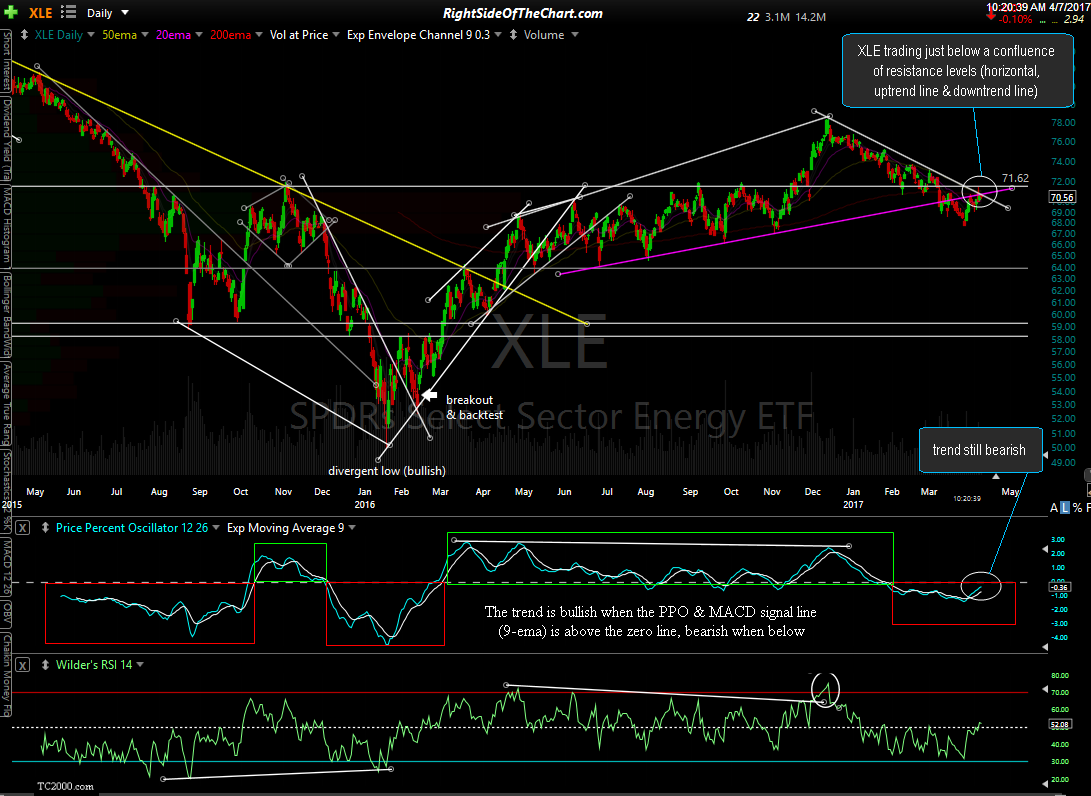
XLE (Energy Sector ETF) is currently trading just below a confluence of resistance levels (horizontal, uptrend line & downtrend line) while the intermediate-term trend remains bearish. Obviously, a break above all three resistance levels, particular the 71.65ish level, would be bullish, especially if confirmed with a bullish cross above the zero line with the PPO signal line. However, until & unless those buy signals occur, the energy sector remains in a clear downtrend for the time being with the potential to fall all the way back to the 64 level, over 9% below where XLE is trading at this time.
XLE daily April 7th