
The most significant levels that I’ve been monitoring in recent months on the biotech sector is this large symmetrical triangle pattern (yellow). Today’s rally has taken XBI within 1% of the top of the triangle which is likely to either act as resistance when hit, sending prices lower, or a breakout followed by a rally, if XBI can take it out with conviction.
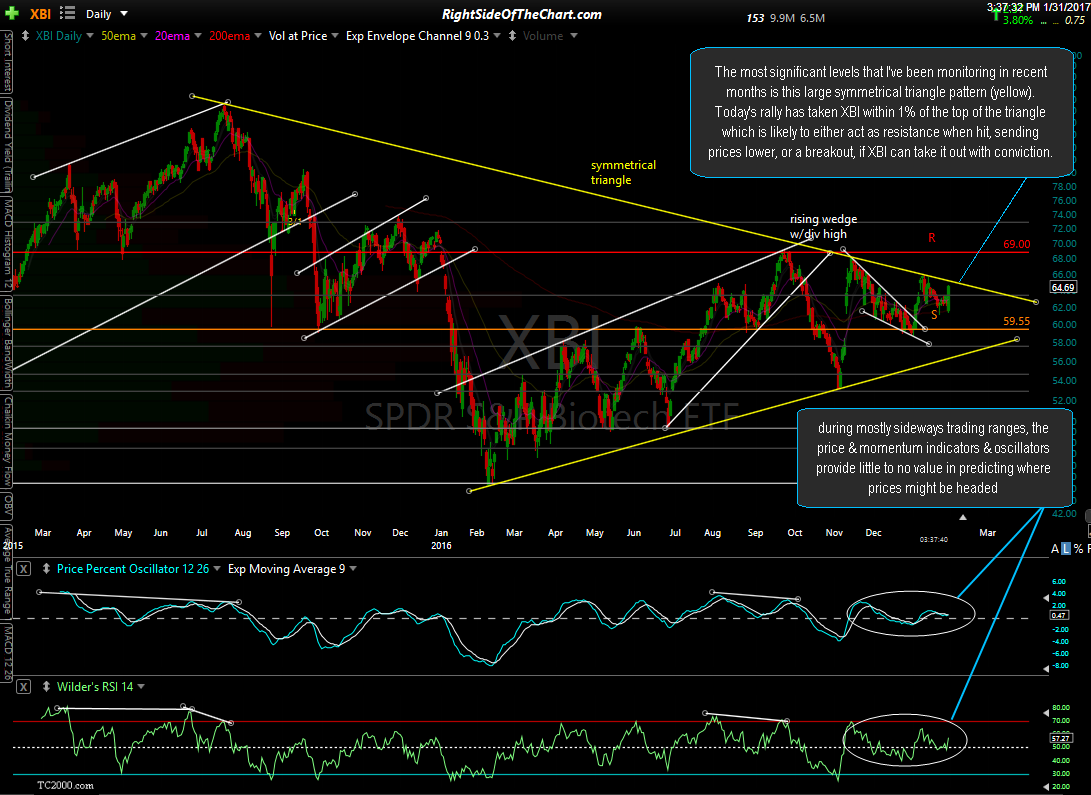
XBI daily Jan 31st
Symmetrical triangle patterns can break either way & during mostly sideways trading ranges, as the biotechs has been in recently, the price & momentum indicators & oscillators provide little to no value in predicting where prices might be headed. As such, there are a several options for those interested in trading the biotechs:
- Short the next tag (or near tag) of the top of the triangle pattern with a stop somewhat above as that downtrend line is still resistance until/unless taken out. This could provide a quick ‘pullback off resistance’ trade, a swing trade down to the 59.55ish support level and/or the bottom of the triangle pattern or one could let that short position ride (if not stopped out), anticipating a breakdown below the triangle, which would have longer-term bearish implications.
- Those bullish on the biotechs could take (or add to) a long position on a convincing breakout above the top of the pattern, possibly with a half-position, allowing to bring the trade to a full position on a possible backtest of the triangle from above following the breakout.
- Sit tight for now & wait to see if the 60-minute bearish rising wedge pattern on SPY follows the lead of the breakdown in QQQ 60-minute wedge earlier today, as the probability of the biotechs rallying during a broad market sell-off is quite low (my preference FWIW).
@jaylop8