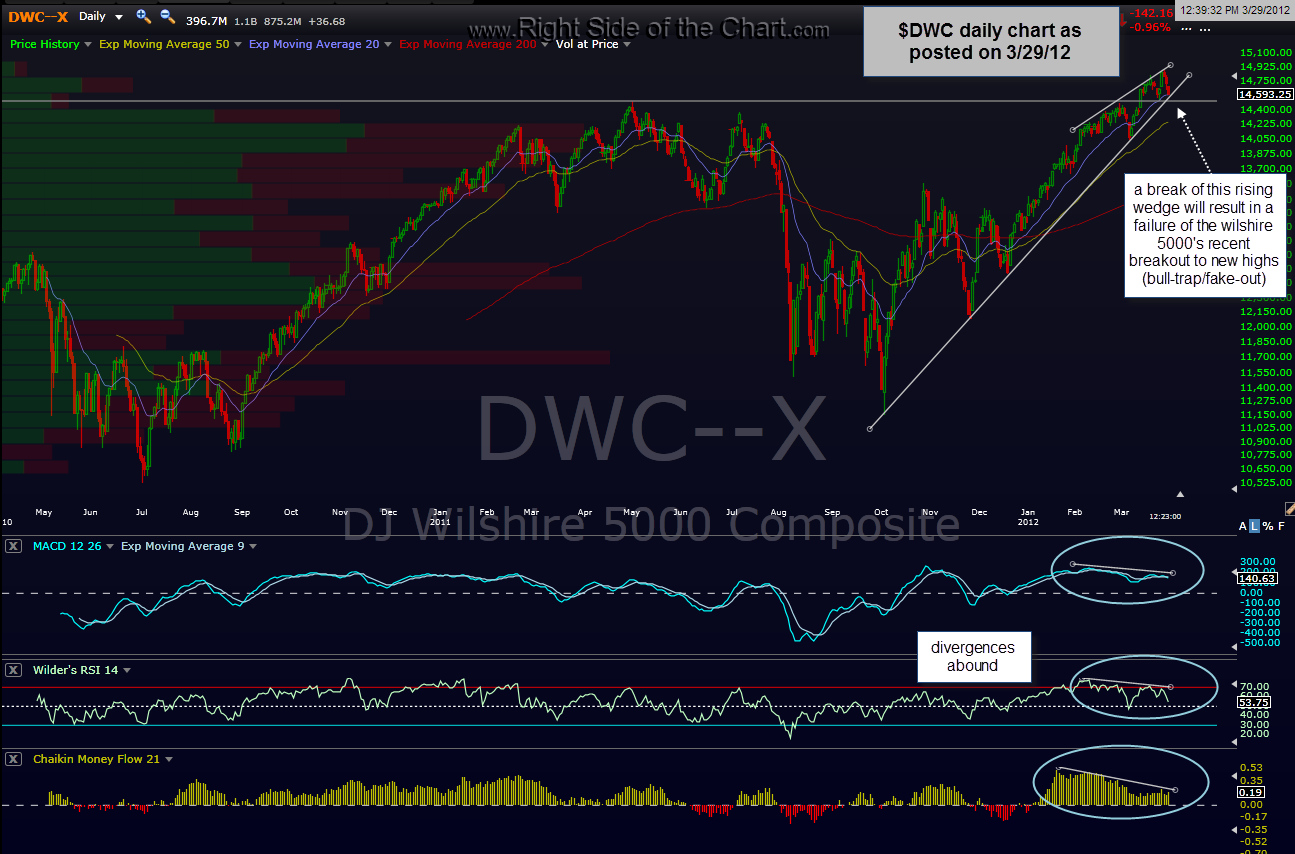
back on thursday march 29th of this year, exactly 2 trading sessions before the market peaked on april 2nd and began an 11%+ correction, i made the following post:
the Wilshire 5000 is probably the single-most representative index of the US stock market. looks like a break of this falling wedge will most likely result in a failure of the recent breakout to new highs. sometimes these failures will only take prices slightly below the key support area, sucking in some more shorts and shaking out the last of the weak-handed longs before continuing higher but a failure to hold these new highs could also prove to be a bull-trap/fake-out. hopefully, the market action following a breakdown (if it comes) will give us clues as whether to buy the dip so sell into it. regardless, for the time being i still believe the R/R is skewed towards being net short vs. net long (or market neutral/cash for more conservative traders/investors). that post can also be viewed by clicking here
sound familiar? i’ve probably used the term bull-trap a dozen times over the last couple of weeks. really nothing much changes in trading over time except for the date: at market peaks, almost everyone is bullish and the few remaining bears have pretty much capitulated in both positioning (covering the last of their shorts) and spirit (losing the will to short again, even if bearish in rhetoric). maybe it really is different this time (no, not really…just kidding) although i do realize that the powers-that-be might just be able to continue to ramp this market into the election as anything is possible. as i like to say, the technicals and price action always seem most bullish at the top (and vice versa at bottoms) and although i am definitely guilty of moving towards a bearish bias too early this time around, i am even more bearish today than i was a few weeks ago.
as all these red flags, both technically and fundamentally, continue to mount, we still need a high probability sign of a technical reversal in the market in order to give an “all-clear” signal on shorting aggressively and/or removing all long positions. one example might be a multi-day candlestick reversal pattern. better yet would be a series of bearish technical events. as i have recently mentioned, i’m on the lookout for a potential 3-step process which would greatly increase the odds of a correction in the broad markets:
1) prices fall back within the wedges following the recent wedge overthrows. today prices gapped back in the some of these wedges only to close right about on the upper wedge-line. bottom line: still awaiting confirmation.
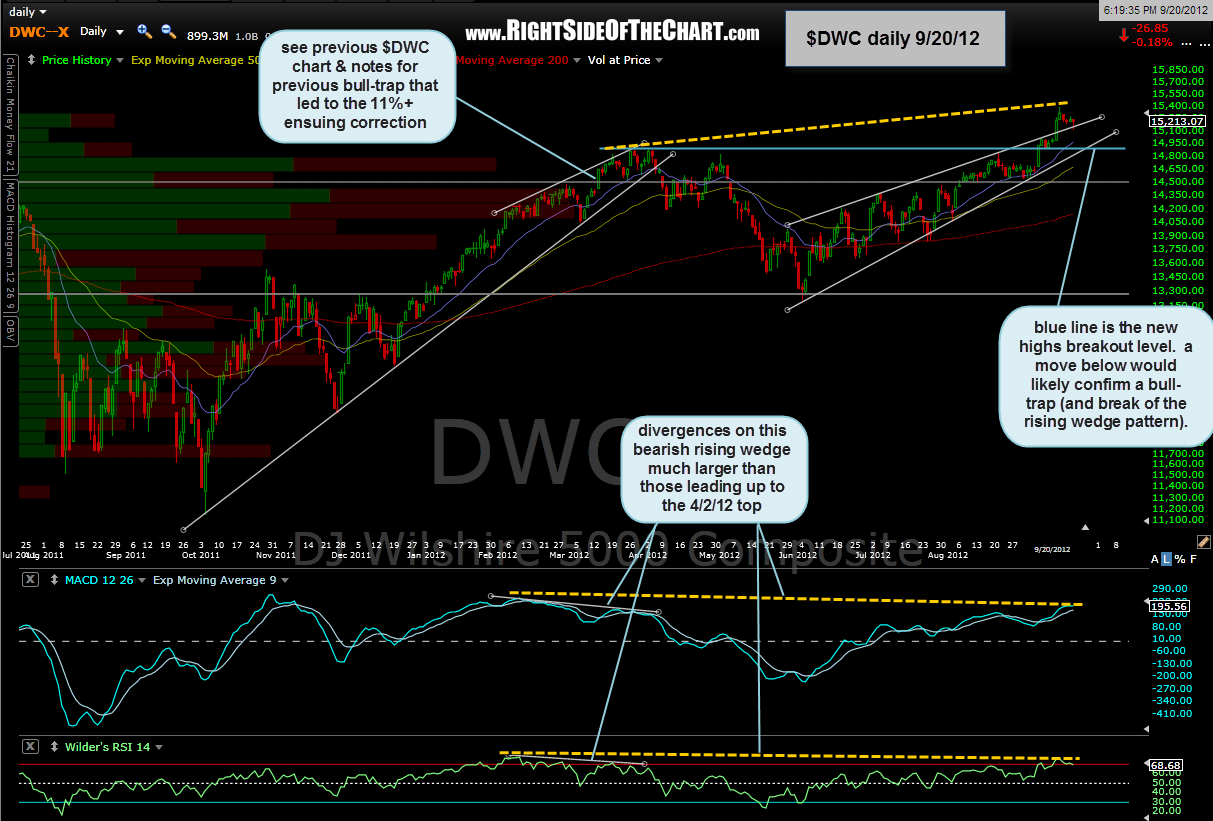
2) prices then break down below the bottom of these daily rising wedges (preferably on impulsive price action)
3) prices then continue lower and break below the levels where they recently broke-out to new highs (at least on those indexes which did…several indices and sectors haven’t yet, a sign of non-confirmation so far).
therefore, the final stage in this process would likely confirm that the recent breakout to new highs in the US markets was a bull-trap, just as the charts below show happened earlier this year before the 2 month, ~11% correction ensued. more importantly, as the dashed orange lines on the current $DWC (wilshire 5000) show, we now have much larger peak-to-peak divergences in place on almost all the major indices (the bigger the divergences, the harder they fall). finally, i often hear “yeah, but the market leaders are strong. the market leaders must first roll over before a correction begins”. although at times we do see that happen, more often than not, the market leaders peak either with or often after the broad market, as a quick glance at the price action on the stocks like AAPL, AMZN, CMG, etc..around the 4/2/12 market peak will confirm.
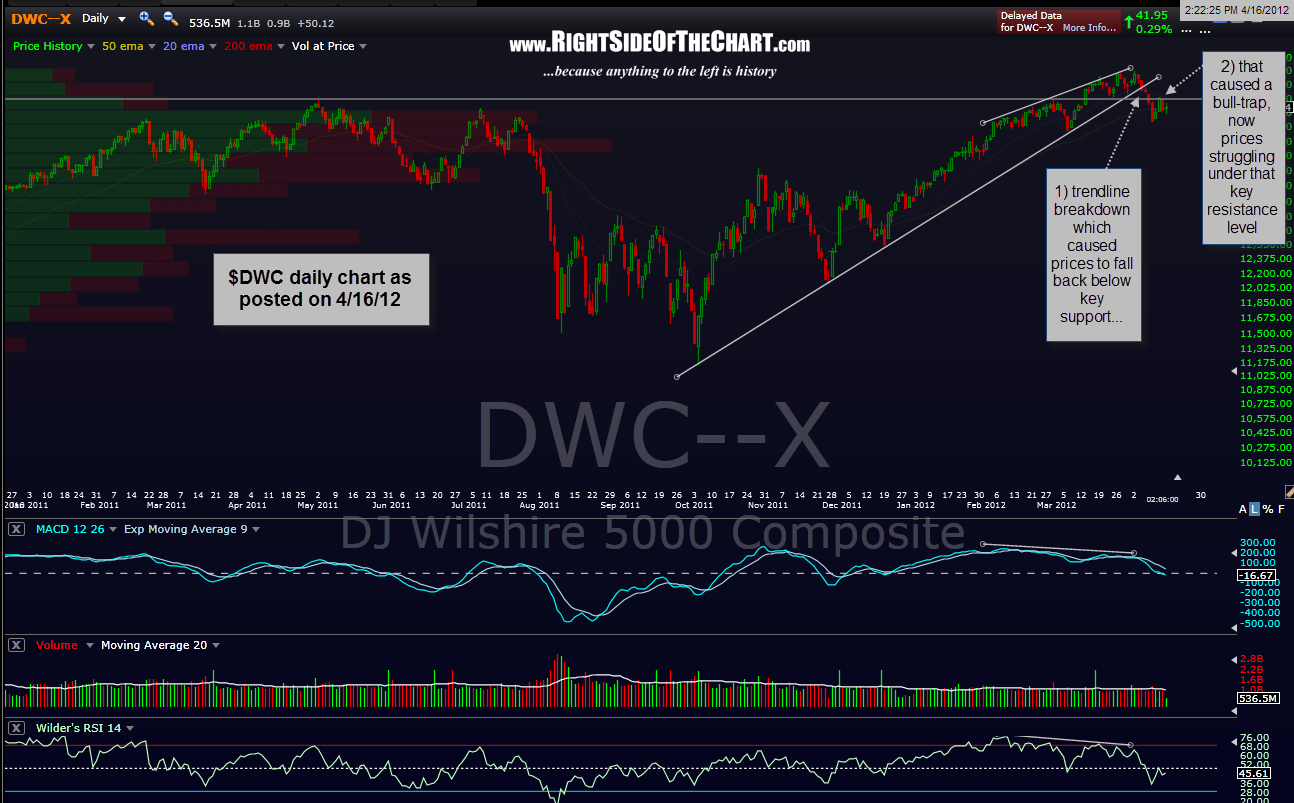
the reason that i have re-posted those comments from earlier this year is one of the main reasons that i started this site; as a trading journal and way to quickly look back at various points in the market to see what i was thinking and how i was interpreting the charts and other factors at the time. as the last few weeks reminds me so much of the market action and sentiment leading up to the april ’12 highs, i figured that i’d read through some of those posts (i also encourage everyone to take advantage of the archives located on the sidebar to the right of the page). the first two charts below of the wilshire 5000 were posted on 3/29/12 & 4/16/12 (right before & shortly after the 4/2 top). the final chart is the updated chart showing the current rising wedge pattern with the recent wedge overthrow.