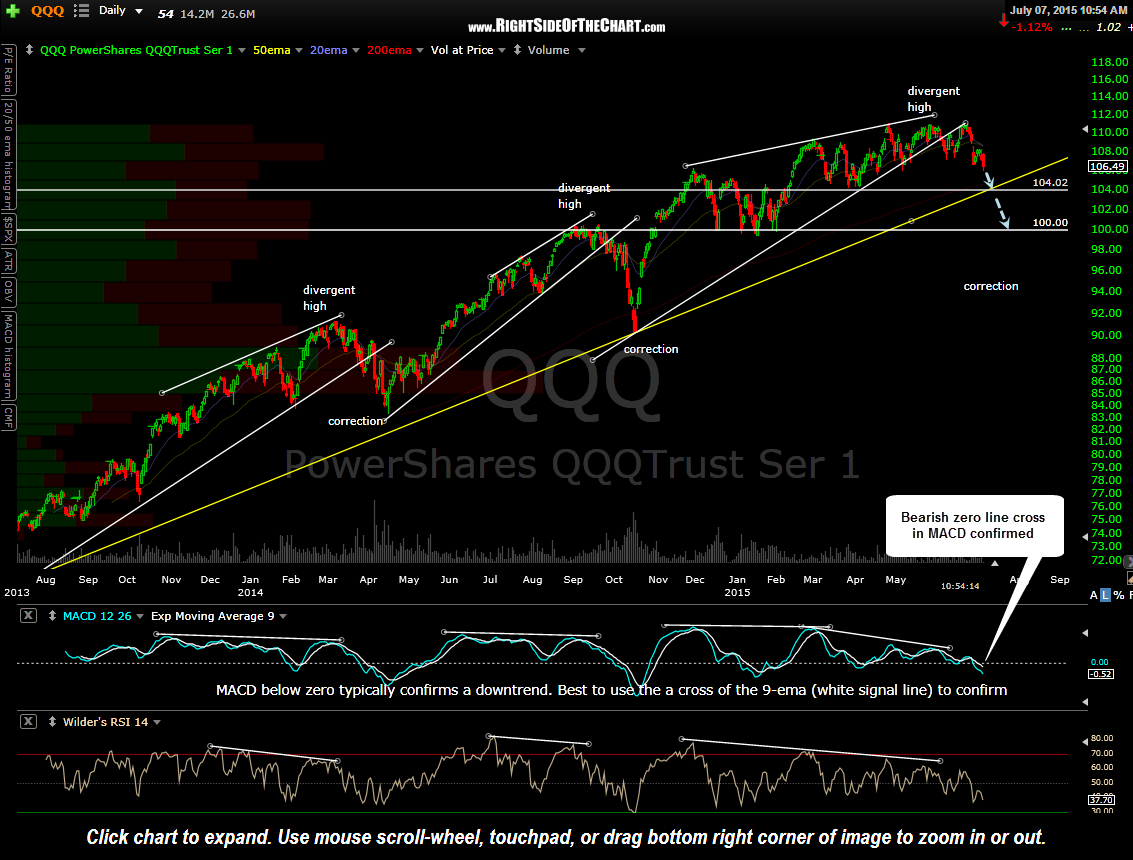
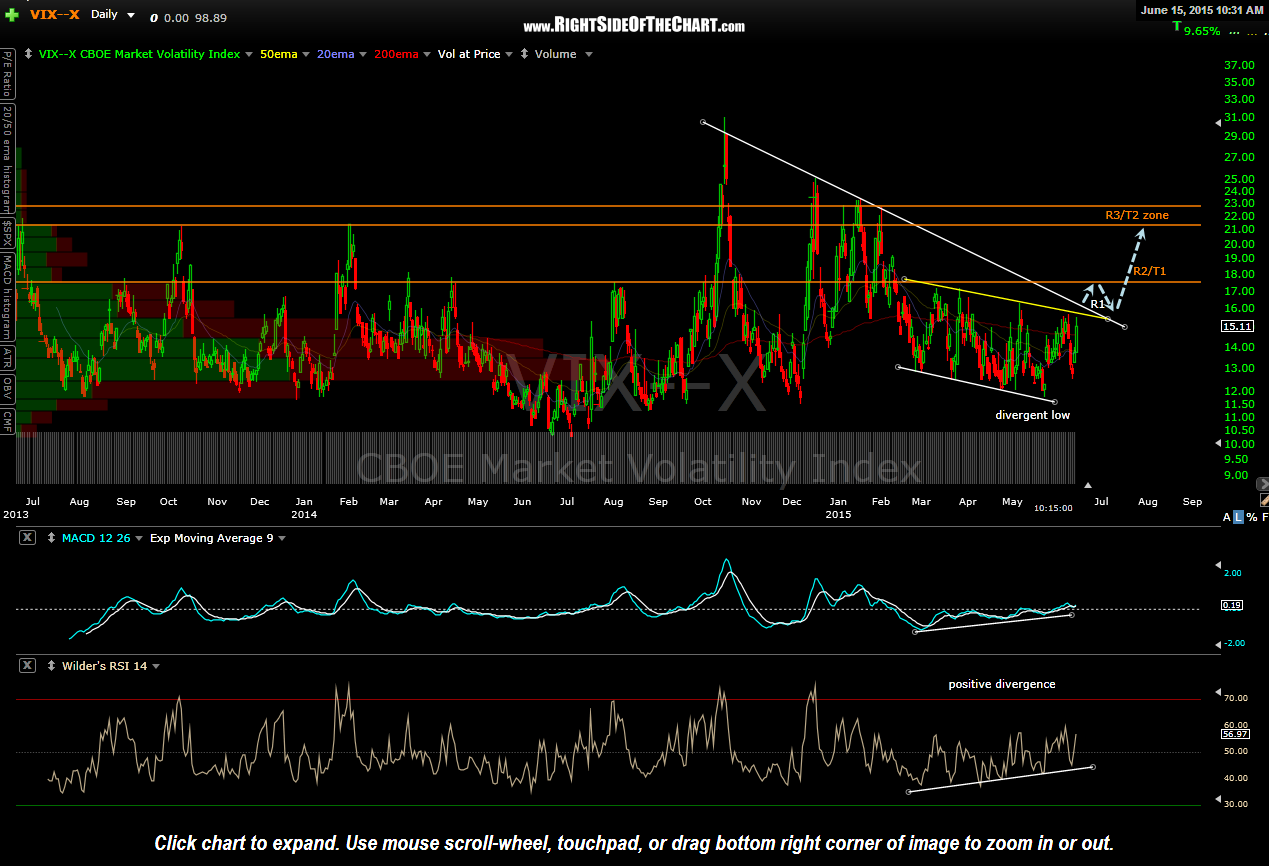
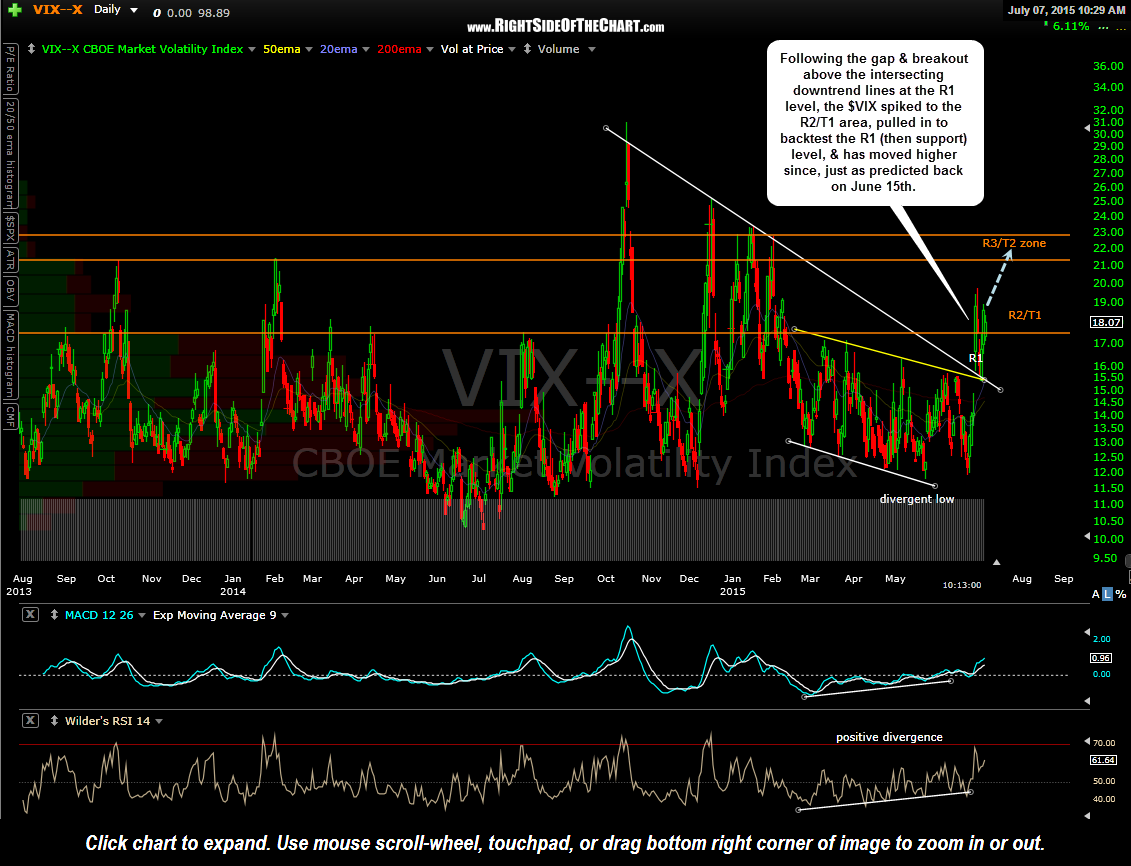
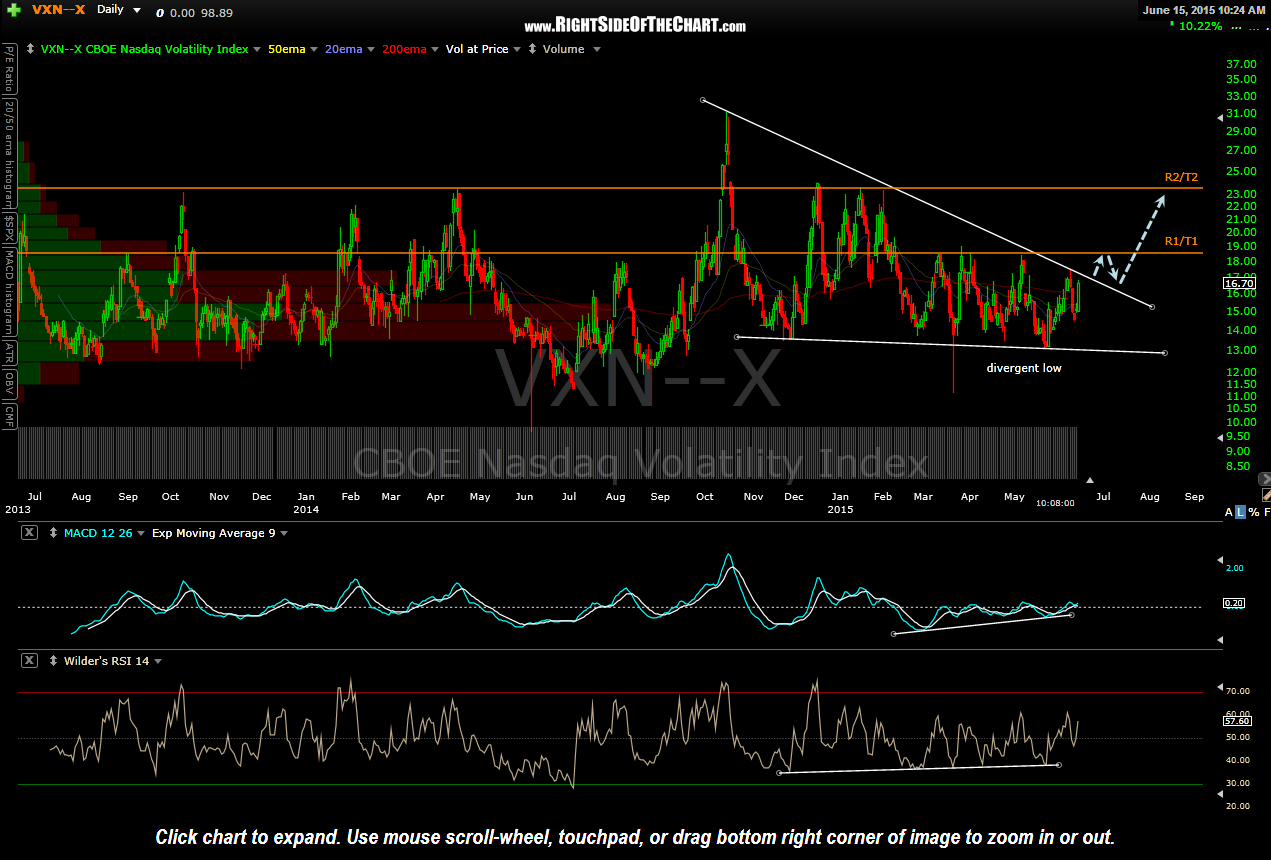
Since the June 2nd Volatility Likely to Spike post, the $VIX has climbed as high as 40% following the breakout of the R1 level & is currently trading about 30% higher following the expected backtest of that broken resistance level. If the scenarios posted here on June 15th (also shown below) continue to play out, as is still my expectation, then we should see a continued move higher in both the $VIX (CBOE Market Volatility Index) and $VXN (CBOE Nasdaq Volatility Index) up towards the next target levels. Such a spike in volatility is likely to coincide with a move down to the previous highlighted downside targets of the 104 & 100 levels on the QQQ.
Previous & updated $VIX & $VXN charts followed by the updated QQQ daily chart below.
-

- $VIX daily June 15th
-
- $VIX daily July 7th
-
- $VXN daily June 15th
-
- $VXN daily July 7th

-
- QQQ daily July 7th