
This 60 minute chart of UUP meshes with my previous comments on how both GDX & GLD have so far reversed just shy of their resistance/target levels. While my downside target for the pullback in UUP was this horizontal line at 25.25, so far UUP found support at the bottom of this 60-minute falling wedge pattern and bounced sharply higher (note: a slight adjustment was made to the lower wedge trendline since the previous version of this wedge was posted yesterday).
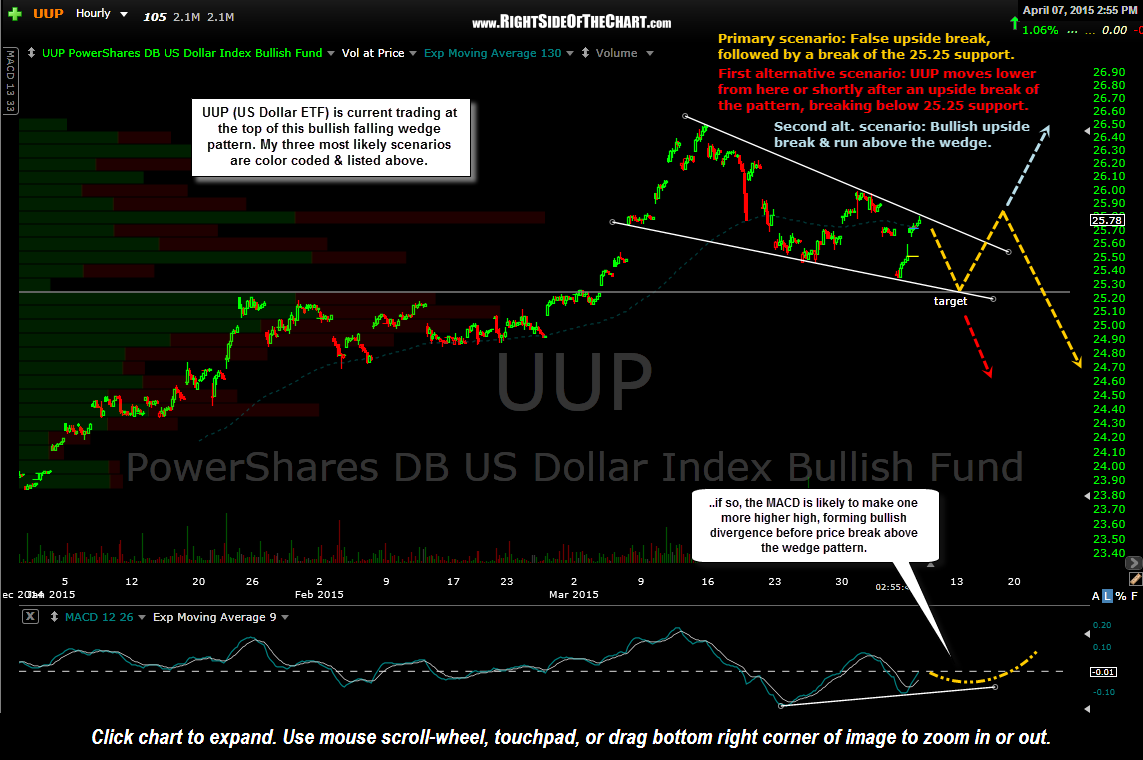
UUP 60 min April 7th
My take from here is this: Yesterday’s tag of the bottom of this wedge pattern, which like GDX & GLD, occurred just shy of a significant horizontal support level (resistance for GLD & GDX, as they move opposite the dollar) may prove to be the end of the correction in the US dollar that I predicted in the “Correction In The Dollar Imminent” post from March 10th, just 3 days before the dollar peaked and began the largest correction since 2013.
At this point I see a mixed bag of bullish and bearish technicals for the $USD. This bullish falling wedge pattern (60-minute chart) certainly merits attention as an upside breakout would clearly be a bullish event and could spark the next leg up in the Greenback’s primary uptrend. I also still lean towards the original pullback target that was posted on the $USD daily chart in that March 10th post, which is the primary uptrend line shown on this daily chart of the $USD (the original can be viewed in the link to the March 10th post).
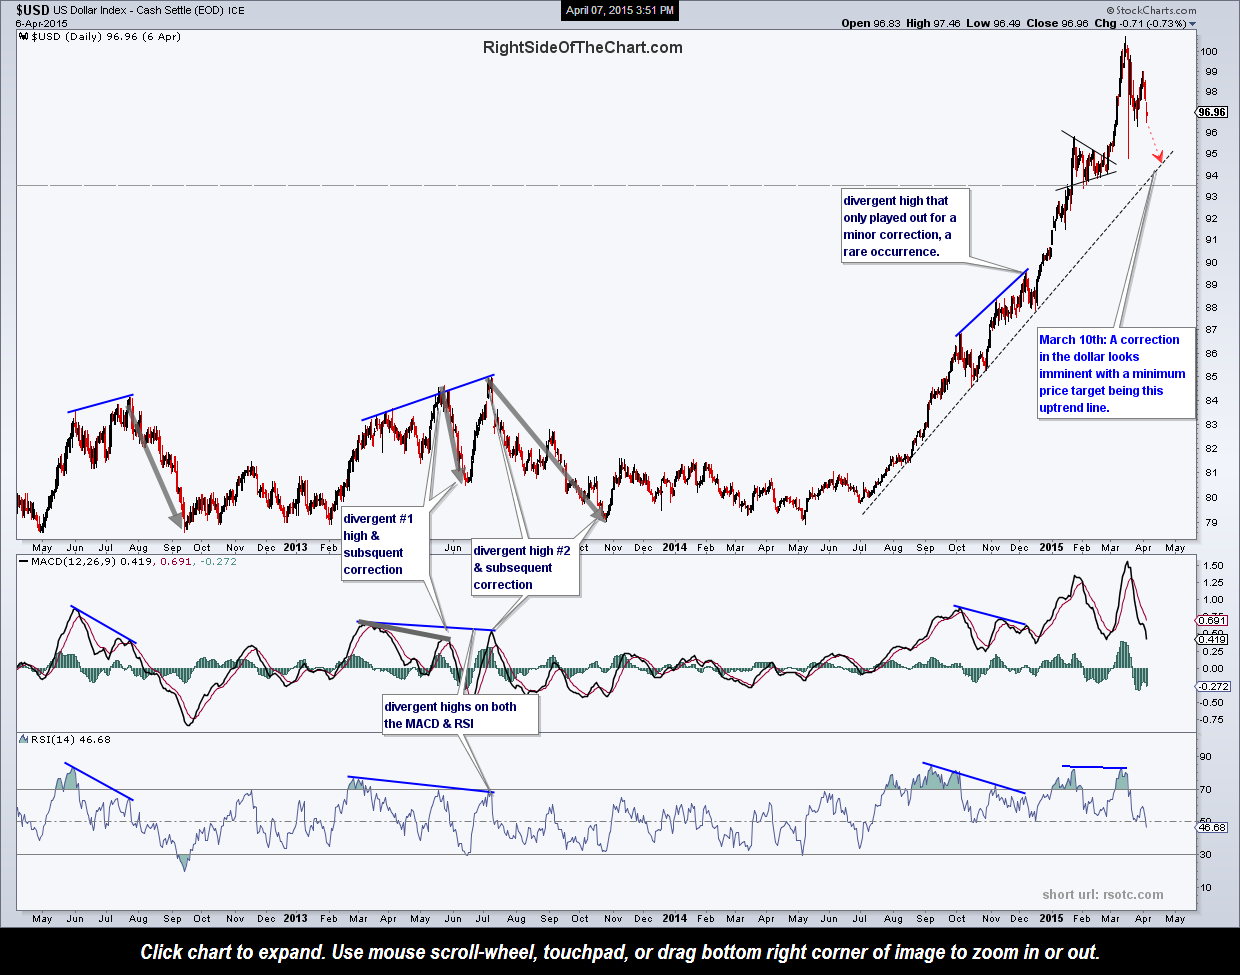
$USD daily April 7th
The longer-term outlook for the dollar, as well as precious metals and commodities will be largely dependent on how the dollar trades following a resolution of this falling wedge pattern. Although I normally only provide my primary scenario, occasionally along with my alternative scenario, my confidence on the next big move in the dollar from here isn’t high enough at this time so I’ve decided to list out the three most likely paths the US Dollar (via UUP) is likely to take going forward. Those scenarios, also listed on this 60-minute chart in descending order of likelihood, are:
- A false upside breakout above the falling wedge pattern, followed by a break of the 25.25 support and a continued move lower towards the primary uptrend line on the daily $USD chart.
- UUP moves lower from here or shortly after an upside break of the pattern in the next day or two, going on to break below 25.25 support. Remember, downside breakouts of inherently bullish charts patterns, such as this bullish falling wedge pattern, are often very powerful sell signals as the masses are caught off-guard and must scramble to quickly reposition accordingly.
- My third and least likely scenario, which is still quite possible and worth mentioning, would be an upside breakout of the falling wedge pattern, possibly with a successful backtest, followed by a resumption of the primary uptrend in the US Dollar.