
USO (crude ETP) is approaching the apex of this symmetrical triangle pattern (60-minute chart) & could break either way. Although USO could reverse off either of the nearby support & resistance levels shown below (10.70 & 9.90), the direction in which this pattern breaks is likely to determine the next near-term trend in crude oil. Also note that the solar stock are likely to follow crude so a downside resolution of this pattern is likely to bring the solar stocks down as well and vice versa.
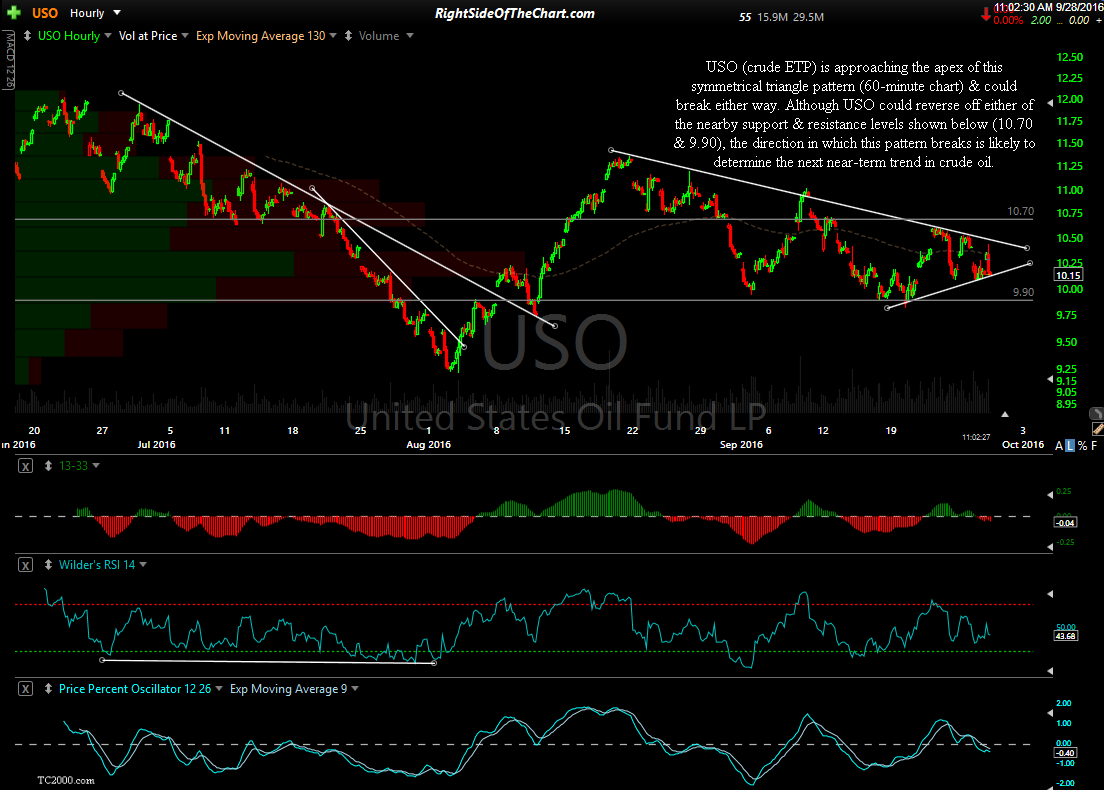
USO 60-minute Sept 28th