
In this video I share a custom indicator that I have created which displays the percentage that an index, stock, ETF, sector, etc… is trading above or below a particular moving average. Detailed instructions are provided on how to create this indicator as well as how to use it to help identify potential rallies & corrections in the underlying security. The are also some significant technical developments currently in place with this indicator that are discussed with QQQ (Nasdaq 100 Tracking ETF).
After recording the video, I played around with some of the configurations in the TC2000 charting platform & wrote a formula to provide an alternative method for creating the same custom indicator that was shown in the video. The method in the video shows how to reconfigure the PPO (Price Percentage Oscillator) to create the custom indicator while I was also able to replicate the same indicator using the formula below. This formula might be applicable to some other charting platforms that don’t offer a PPO as one of the available indicators
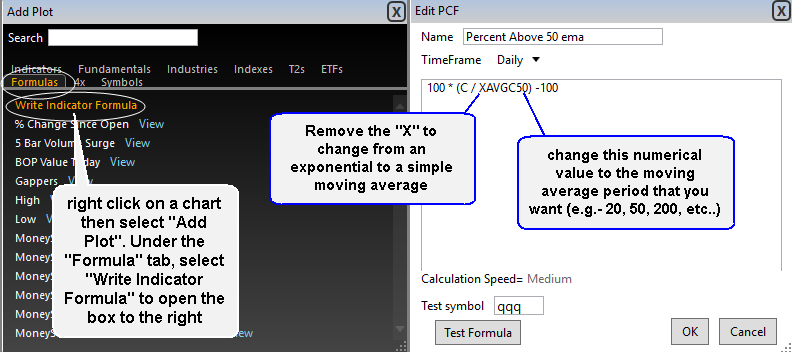
Percent Above MA Formula TC2000